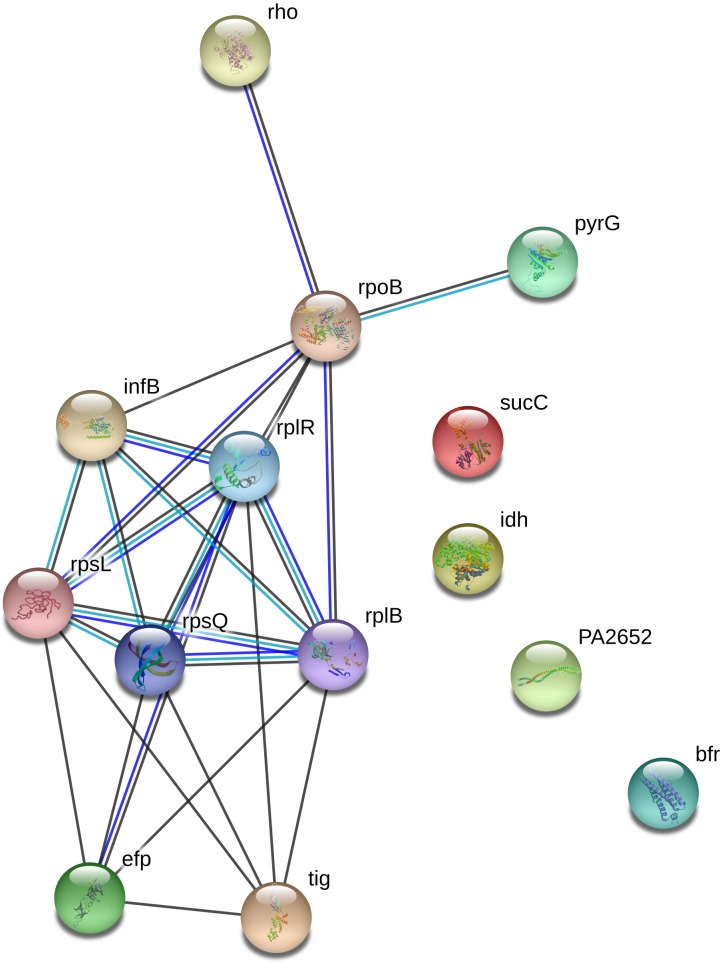
Fig 1. Protein interactions for unique and significantly increased proteins in plasma-treated P. aeruginosa biofilms.
Interactions were detected by STRING (29). Lines indicate known or predicted protein–protein interactions. Black lines indicate proteins that are co-expressed, green lines indicate proteins within the same gene neighbourhood, blue lines indicate proteins that may be functionally linked based on gene co-occurrence. These networks show the interactions between proteins associated with metabolic processing.

