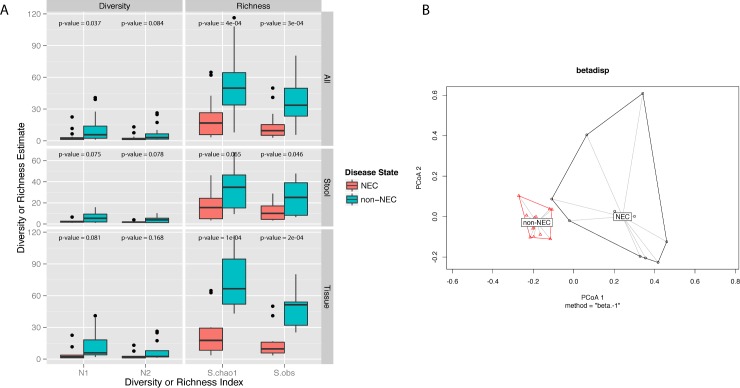
Fig 1.
A) Boxplots of tissue microbial diversity and richness in infants with and without necrotizing enterocolitis (NEC) at the operational taxonomic unit (OTU) level for all samples, stool alone, and tissue alone. After rarefaction to the lowest library size of all the samples (445 reads per sample), α diversity and richness estimates were calculated per each sample. This process was repeated 400 times and results were averaged. The Shannon and inverse Simpson indices were calculated to estimate abundance-based OTU diversity, while the Chao1 estimator and observed taxa counts were calculated to estimate abundance-based OTU richness. Displayed p-values were obtained after testing for a non-zero coefficient of a normal linear model that used NEC/non-NEC group membership as predictor of richness or diversity. All tested richness and diversity indices for both tissue and stool samples were at or near significantly lower in NEC compared to non-NEC samples. B) Principal coordinates analysis (PCoA) plot of tissue samples, labelled by NEC status. Bray-Curtis dissimilarities between samples were calculated at the genus level after normalizing read counts to simple proportions and after rarefaction to the lowest library size (445 reads per sample). The centroids between the NEC and non-NEC samples were significantly dissimilar (Adonis PerMANOVA p-value = 0.0002).

