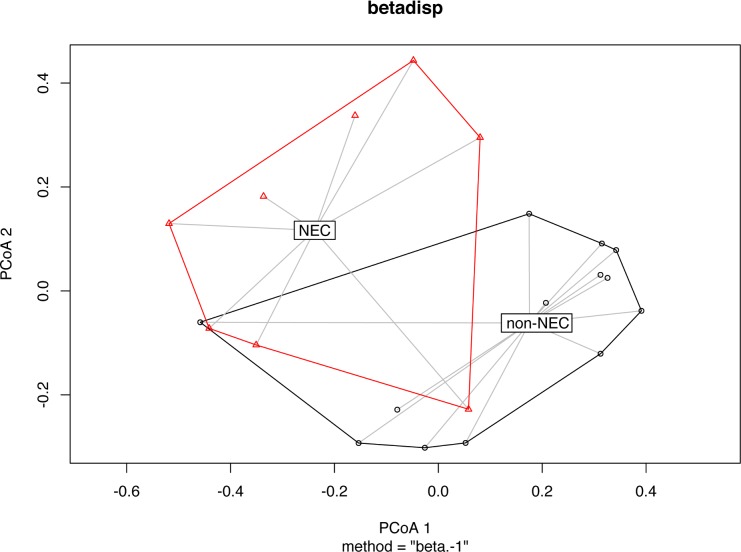
Fig 2. Principal coordinates analysis (PCoA) plots of stool samples, labelled by necrotizing enterocolitis (NEC) status.
Bray-Curtis dissimilarities between samples were calculated at the genus level after normalizing read counts to simple proportions. The centroids between the NEC and non-NEC samples were significantly dissimilar (Adonis PerMANOVA p-value = 0.003).

