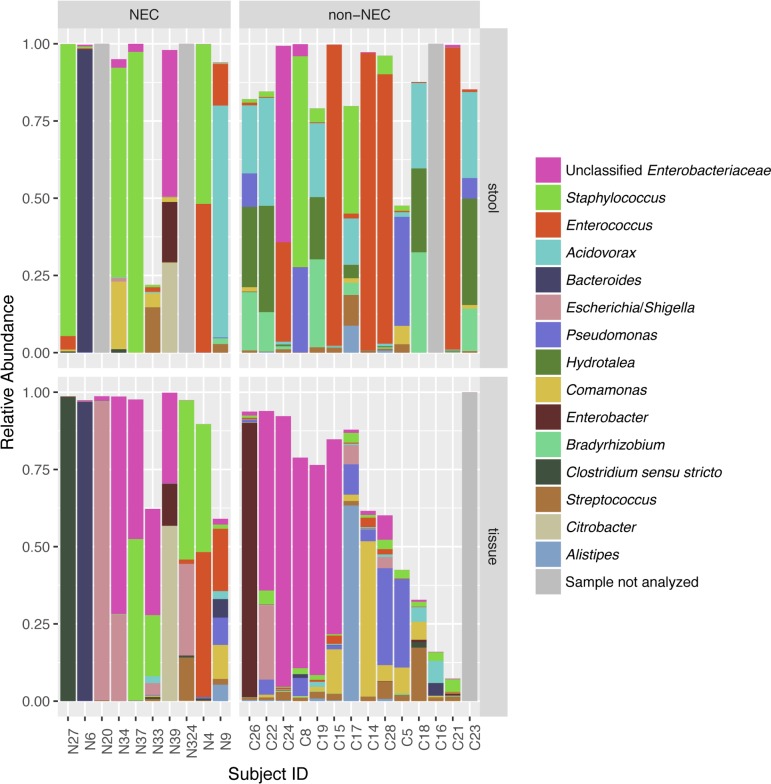
Fig 4. Stacked bar graph showing genus level taxonomic composition for each individual sample, expressed as a proportion of reads.
Infant sample ID is on the x-axis. The top 15 genera with the highest average relative abundance are shown. Samples are stratified by necrotizing enterocolitis (NEC) status, and whether sample was tissue or stool. Tissue and stool samples from the same infant had dissimilar microbial profiles.

