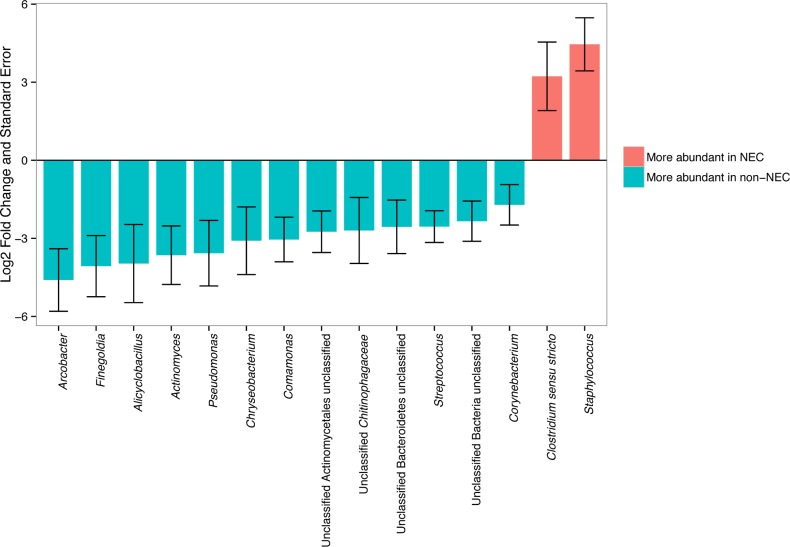
Fig 5. Comparison of the abundance of tissue bacterial genera between infants with and without necrotizing enterocolitis (NEC).
Only bacterial genera that were significantly different between groups after adjusting for multiple comparisons using the DESeq2 package (see text for details) are indicated by an asterisk. Log2 fold change and log2 fold change standard error of tissue bacterial genera according to NEC status as calculated with the DESeq2 analysis. A log2 fold change of >0 (pink bars) indicates that abundance was detected to be higher during NEC, while a log2 fold change <0 (blue bars) indicates that abundance was detected to be higher in infants without NEC.

