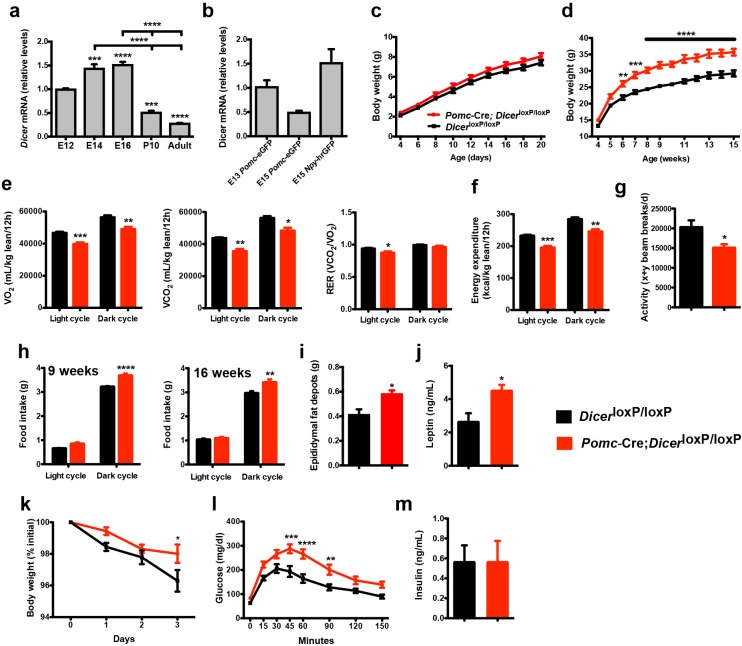
Figure 1. Loss of Dicer in Pomc expressing neurons causes metabolic dysregulation.
(a) Relative expression of Dicer mRNA in the hypothalamus of E12, E14, E16 embryos and in the mediobasal hypothalamus of P10, and adult mice (n = 3 – 5 per group). (b) Relative expression of Dicer mRNA in sorted Pomc-eGFP cells at E13 and E15 and Npy-hrGFP cells at E15 (n = 2 – 4 per group). (c) Pre- and (d) post-weaning growth curves (body weights) of DicerloxP/loxP and Pomc-Cre; DicerloxP/loxP male mice (n ≥ 8 per group). (e) VO2, VCO2 and respiratory exchange ratio (RER) of 15-week-old DicerloxP/loxP and Pomc-Cre; DicerloxP/loxP male mice (n = 4 – 6 per group). (f) Energy expenditure of 15-week-old DicerloxP/loxP and Pomc-Cre; DicerloxP/loxP male mice (n = 4 – 6 per group). (g) Locomotor activity of 15-week-old DicerloxP/loxP and Pomc-Cre; DicerloxP/loxP male mice (n = 4 – 6 per group). (h) Cumulative food intake of 9- and 16-week-old DicerloxP/loxP and Pomc-Cre; DicerloxP/loxP male mice (n = 5 – 6 per group). (i) Epididymal fat mass of 20- to 23-week-old male mice (n = 4 – 5 per group). (j) Plasma leptin levels in 20- to 23-week-old DicerloxP/loxP and Pomc-Cre; DicerloxP/loxP male mice (n = 4 – 5 per group). (k) Leptin-induced weight loss in 14-week-old DicerloxP/loxP and Pomc-Cre; DicerloxP/loxP male (n = 5 per group). (l) Glucose tolerance test of 10- to 11-week-old male mice (n ≥ 7 per group). (m) Plasma insulin levels in 20- to 23-week-old DicerloxP/loxP and Pomc-Cre; DicerloxP/loxP male mice (n = 6 per group). Values are shown as mean ±SEM. *p≤0.05 versus DicerloxP/loxP (e, g, i, j); **p≤0.01 versus DicerloxP/loxP (d, e, f, h, l); ***p≤0.001 versus E12 WT (a), versus DicerloxP/loxP (d, e, f, l); ****p≤0.0001 versus E12 WT (a), versus E14 WT (a), versus E16 WT (a), versus DicerloxP/loxP (d, l). Statistical significance was determined using 2-tailed Student’s t test (e, f, g, i, j, m), 1-way ANOVA followed by Turkey’s post hoc test (a, b) and 2-way ANOVA followed by Bonferroni’s post hoc test (c, d, h, k, l).


