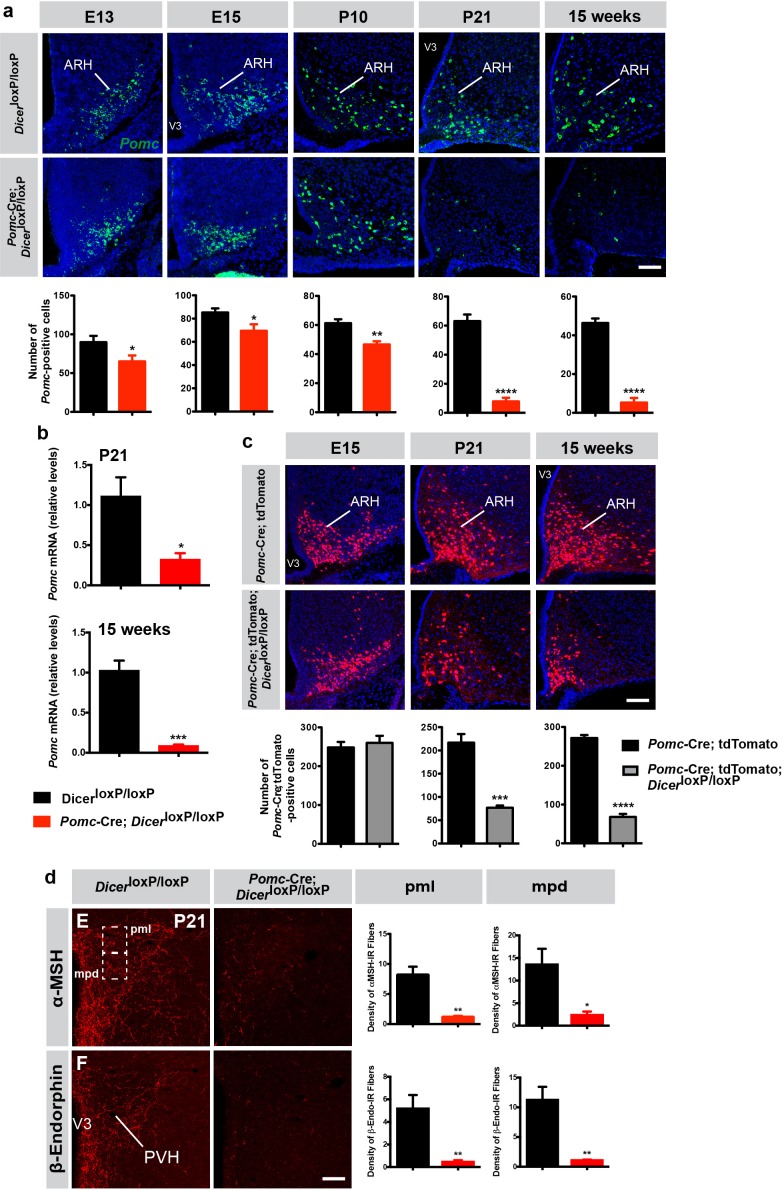
Figure 2. Reduced number of Pomc mRNA-expressing cells in mice lacking Dicer in POMC neurons.
(a) Representative images and quantification of Pomc mRNA-expressing cells in the arcuate nucleus (ARH) of E13 (n = 6 per group), E15 (n = 6 – 8 per group), P10 (n = 4 per group), P21 (n = 4 per group) and 15-week-old (n = 3 – 4 per group) DicerloxP/loxP and Pomc-Cre; DicerloxP/loxP male mice. (b) Relative expression of Pomc mRNA in the mediobasal hypothalamus of P21 and 15-week-old DicerloxP/loxP and Pomc-Cre; DicerloxP/loxP male mice (n = 3 – 4 per group). (c) Representative images and quantification of Pomc-Cre cells genetically labeled by tdTomato in the ARH of E15 (n = 5 – 7 per group), P21 (n = 4 per group) and 15-week-old (n = 3 – 4 per group) Pomc-Cre and Pomc-Cre; DicerloxP/loxP male mice. (d) Representative images and quantification of the density of α-MSH- and β-endorphin-immunopositive fibers (n = 3 – 4 per group) in the posterior magnocellular (pml) and medial parvicellular (mpd) parts of the paraventricular nucleus (PVH) of P21 DicerloxP/loxP and Pomc-Cre; DicerloxP/loxP male mice. Scale bars, 100 μm (a, b, c). Values are shown as mean ± SEM. *p≤0.05 versus DicerloxP/loxP (a, b, d); **p≤0.01 versus DicerloxP/loxP (a, d); ***p≤0.001 versus DicerloxP/loxP (b), versus Pomc-Cre; tdTomato (c); ****p≤0.0001 versus DicerloxP/loxP (a), versus Pomc-Cre; tdTomato (c). Statistical significance was determined using 2-tailed Student’s t test. V3, third ventricle.


