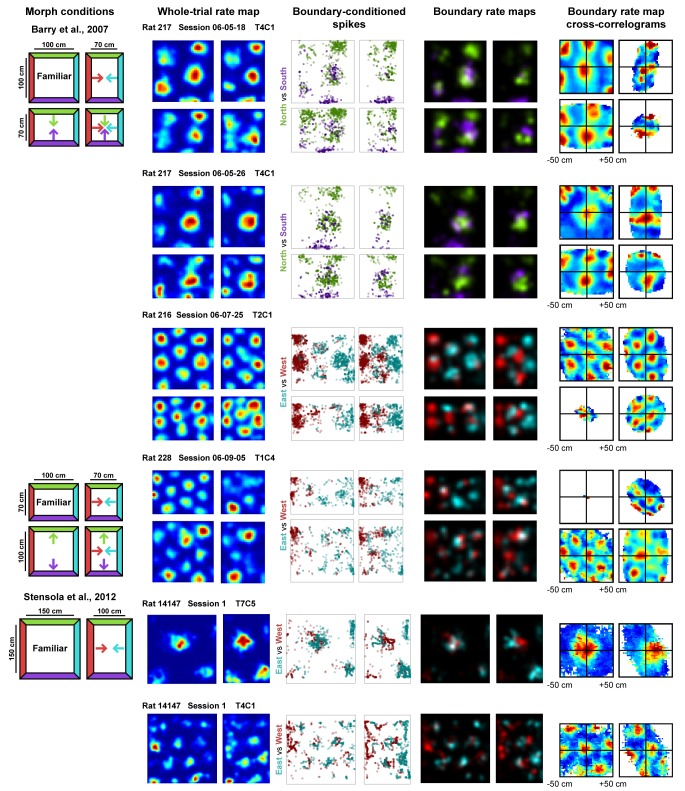
Figure 1. Examples of whole trial rate maps, boundary-conditioned spikes, boundary rate maps, and cross-correlograms of opposing boundary rate maps for recorded grid cells.
Rat, session, and cell identity indicated above whole trial rate maps. Boundary-conditioned spikes and boundary rate maps organized by opposing north-south (green—purple) and east-west (blue—red) boundary pairs. Colored arrows in morph condition indicate the shifts predicted by the boundary-tethered model during each deformation.

