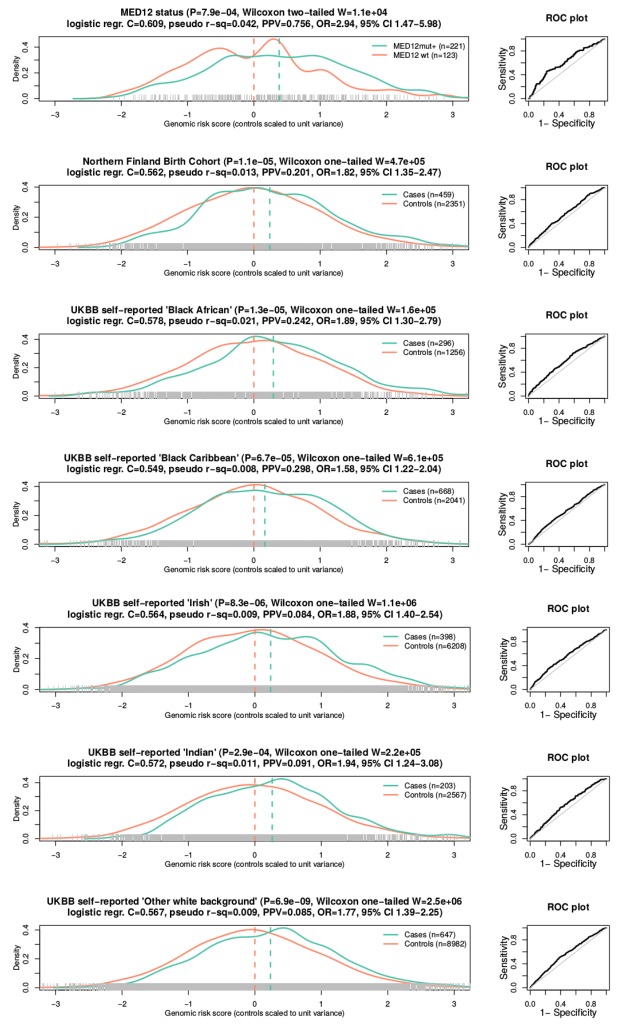
Appendix 1—figure 5. Association between GRS and phenotype.
One somatic phenotype (MED12 mutation status) and six independent case-control replication cohorts. On left, density plots (bandwidth = 0.2) for each phenotype. X-axis gives GRS values scaled to unit variance with respect to the controls. Dashed lines denote the mean GRS for cases and controls. Associations (P) and test statistics (W) are from Wilcoxon rank-sum tests. C-scores, Nagelkerke’s R2 (pseudo R2) and Receiver operating characteristic (ROC; on right) are from a logistic regression model. Positive predictive values (PPV) were computed from the highest GRS quartile, and odds ratios (OR and 95% CI) from the top and bottom GRS quartiles.

