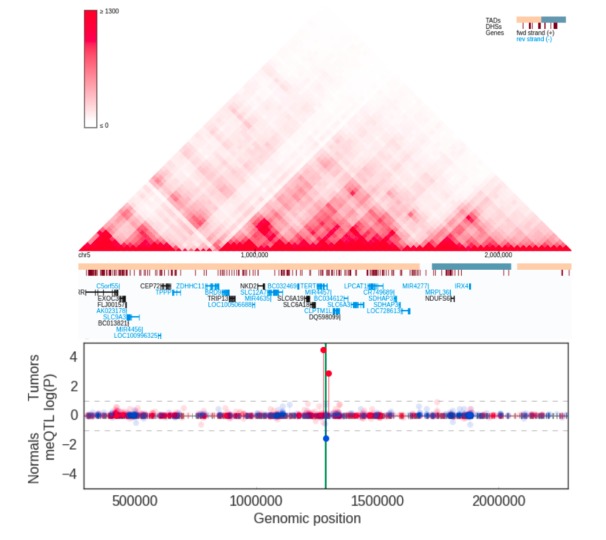
Appendix 1—figure 9. meQTLs at TERT region.
Hi-C, TADs and CpG methylation around rs2736100 with an 1Mbp flank. The needle plot shows the meQTL associations (dashed lines at 10% FDR; green line denotes the two SNPs; gray ticks denote all CpGs tested; blue needle for positive coefficient, red for negative coefficient) for tumors (above x-axis; nAA = 8, nAB = 32, nBB = 16) and normals (below x-axis; nAA = 5, nAB = 22, nBB = 7). The only significant meQTLs were seen around TERT.

