. 2018 Oct 3;7:e37663. doi: 10.7554/eLife.37663

Figure 5. PABPC depletion prevents muSOX-induced repression of RNAPII recruitment.

(A, B) HEK293T cells treated with siRNAs targeting PABPC1 and 4 (A), LARP4 (B), or non-targeting scramble siRNAs were subsequently transfected with either empty vector or muSOX, then subjected to chromatin immunoprecipitation (ChIP) using antibodies to RNAPII or IgG. Western blots showing protein levels of PABPC1, PABPC4, and Larp4 after siRNA depletion are shown in the lower panels, along with a GAPDH loading control. (C) Western blots of nuclear and cytoplasmic fractions of HEK293T cells transfected with an empty vector or a plasmid containing FLAG-PABPC1. GAPDH and histone H3 serve as fractionation and loading controls. (D) HEK293T cells transfected with either empty vector or FLAG-PABPC1 were subjected to ChIP using antibodies to RNAPII or IgG. (E) WT or Xrn1 KO HEK293T cells transfected with either empty vector or FLAG-PABPC1 alone or together with muSOX were subjected to ChIP using antibodies to RNAPII or IgG. Purified chromatin in each of the above experiments was quantified by qPCR. Western blots showing the levels of Xrn1 in WT or Xrn1KO HEK293Ts are shown, along with a GAPDH loading control. All graphs display individual biological replicates as dots, with the mean and SEM. Statistical significance was determined using Student’s t test *p<0.05 **p<0.005 ***p<0.0005.

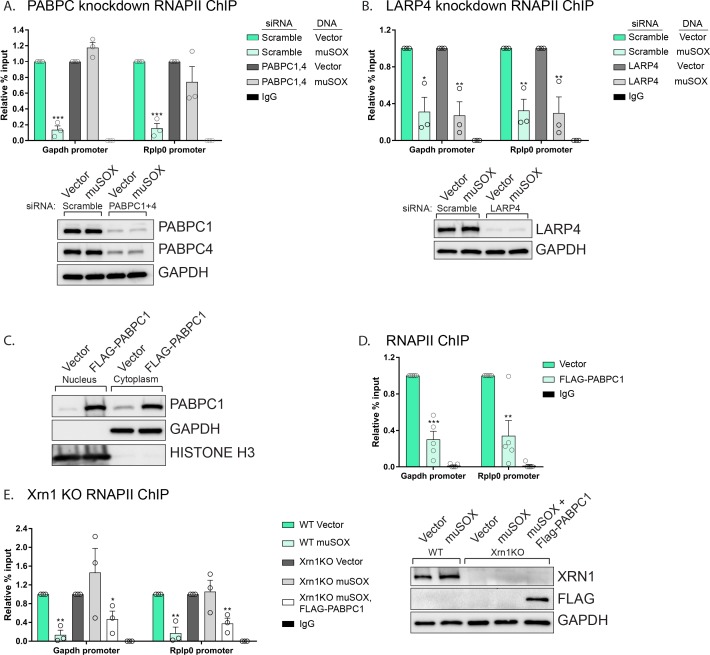
Figure 5.

Figure 5—figure supplement 1. PABPC is required for the connection between cytoplasmic mRNA decay and RNAPII promoter occupancy.

Figure 5—figure supplement 1.

(A,C) HEK293T cells were treated with siRNAs targeting CHD3 (A), MSI1 (B), or TRIM32 (C), or non-targeting scramble siRNAs, then transfected with either empty vector or muSOX and subjected to chromatin immunoprecipitation (ChIP) using antibodies to RNAPII or IgG. Purified chromatin was quantified by qPCR. Western blots showing the levels of CHD3 and MSI1 after siRNA depletion, along with a GAPDH or histone H3 loading control are shown below. Graphs display individual biological replicates as dots, with the mean and SEM. Statistical significance was determined using Student’s t test *p<0.05 **p<0.005 ***p<0.0005.
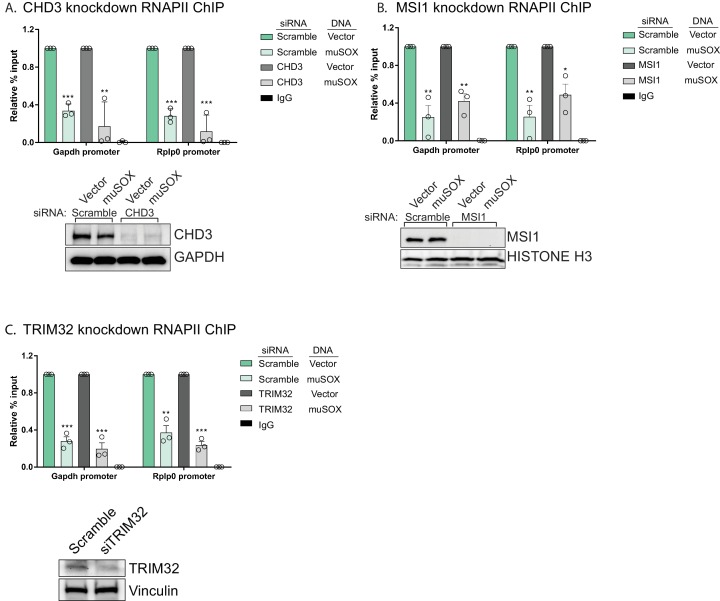
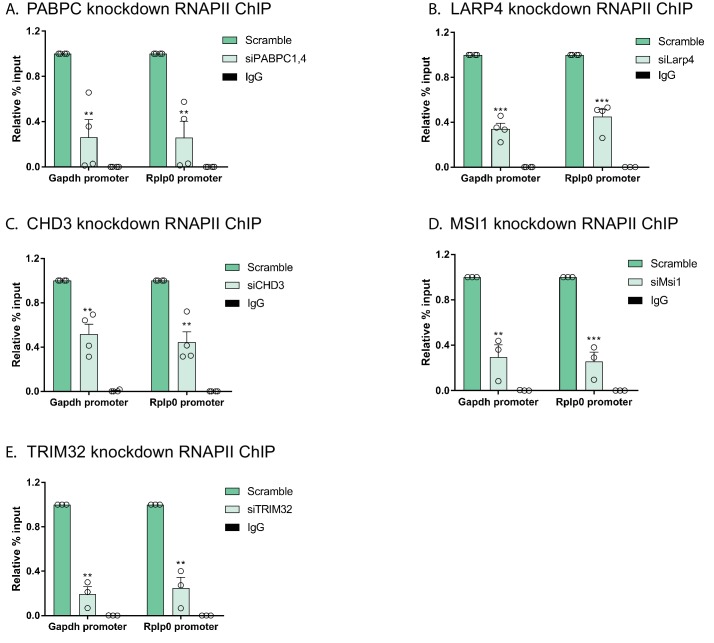
Figure 5—figure supplement 2. Effects of depleting PABPC, LARP4, CHD3, MSI1 and TRIM32 on RNAPII promoter occupancy.

Figure 5—figure supplement 2.

(A–E) HEK293T cells were treated with siRNAs targeting PABPC1 and PABPC4 (A), LARP4 (B), CHD3 (C), MSI1 (D), or TRIM32 (E), and subjected to ChIP using antibodies to RNAPII or IgG. Purified chromatin was quantified by qPCR. All graphs display individual biological replicates as dots, with the mean and SEM. Statistical significance was determined using Student’s t test *p<0.05 **p<0.005 ***p<0.0005.