
Figure 4. Actual versus optimal adjustments of momentary-evidence (me) and decision-rule (z) biases.
(A) Schematic of the comparison procedure. Choice and RT data from the two reward contexts in a given session were fitted separately using the HDDM. These context- and session-specific best-fitting me and z values are plotted as the monkey’s data (black circles in B and C). Optimal values were determined by fixing parameters a, k, and non-decision times at best-fitting values from the HDDM and searching in the me/z grid space for combinations of me and z that produced maximal reward function values. For each me and z combination, the predicted probability of left/right choice and RTs were used with the actual task information (inter-trial interval, error timeout, and reward sizes) to calculate the expected reward rate (RR) and average reward per trial (RTrial). Optimal me/z adjustments were then identified to maximize RR (purple) or RTrial (orange). (B) Scatterplots of the monkeys’ me/z adjustments (black), predicted optimal adjustments for maximal RR (purple), and predicted optimal adjustments for maximal RTrial (orange), for the two reward contexts in all sessions (each data point was from a single session). Values of me > 0 or z > 0.5 produce biases favoring rightward choices. (C) Scatterplots of the differences in me (abscissa) and z (ordinate) between the two reward contexts for monkeys (black), for maximizing RR (purple), and for maximizing RTrial (orange). Positive Δme and Δz values produce biases favoring large-reward choices.

Figure 4—figure supplement 1. Estimates of momentary-evidence (me) and decision-rule (z) biases using the collapsing-bound DDM fits.
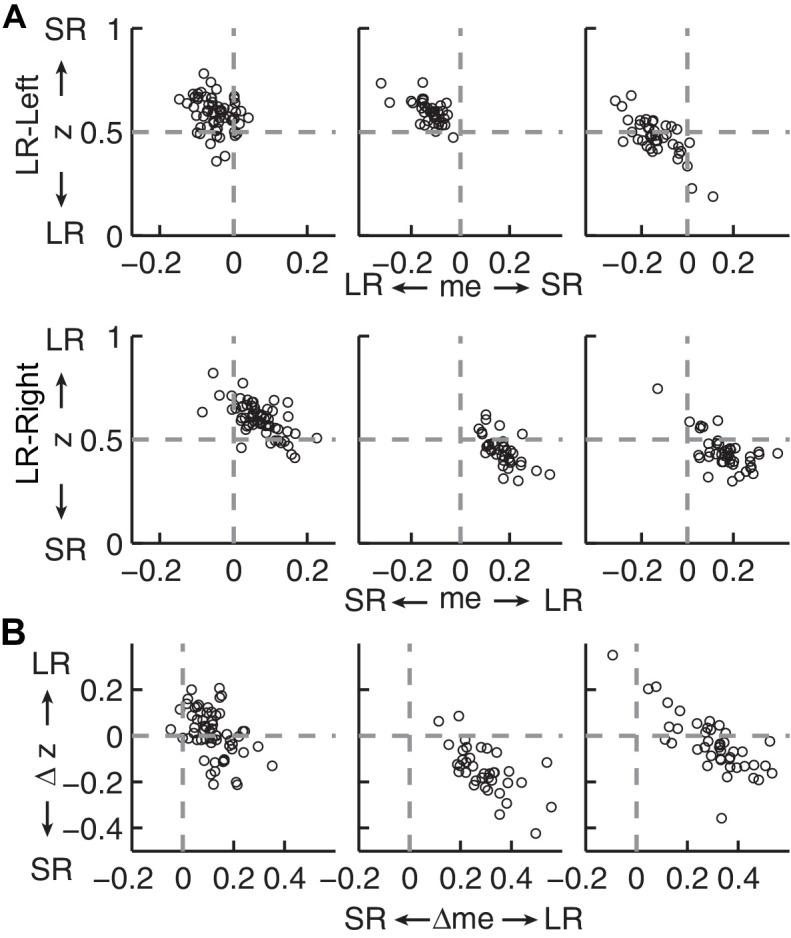
Figure 4—figure supplement 2. Hypothetical neural activity encoding a reward-biased perceptual decision variable.
