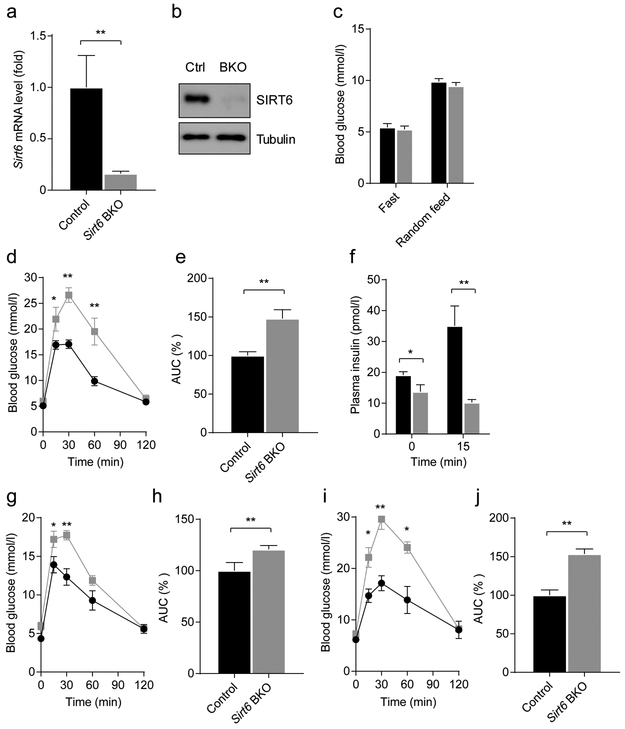
Fig. 4.
Beta cell-specific deletion of Sirt6 leads to defective insulin secretion, (a, b) RT-qPCR analysis of Sirt6 mRNA (a) and immunoblots of SIRT6 expression (b) in islets isolated from control (Ctrl, a combination of MIP1-CreER and Sirt6f/+; MIP1-CreER mice after tamoxifen treatment) and Sirt6 BKO mice 2 weeks after deletion (n=3). (c) Fasting and random-fed blood glucose levels of the 2 weeks post-tamoxifen (2-month-old) control and Sirt6 BKO male mice (n=5–6). (d) Blood glucose during GTTs in 2 weeks post-tamoxifen (2-month-old) control and Sirt6 BKO male mice (n=5 or 6). (e) AUC for blood glucose levels during GTT shown in (d). (f) Plasma insulin levels in the 2 weeks post-tamoxifen (2-month-old) control and Sirt6 BKO mice during the GTT, related to (d) (n=4). (g, h) Blood glucose levels during GTTs (g) and normalised AUCs (h) in 2 weeks post-tamoxifen control and Sirl6 female BKO mice (n=4). (i, j) Blood glucose levels during GTTs (i) and normalised AUCs (j) in 4 months post-tamoxifen control and Sirt6 BKO female mice (n=4 control; n=5 BKO). Black bars and circles, control mice; grey bars and squares, Sirt6 BKO mice. Data are expressed as means ± SEM. *p<0.05 and **P<0.01 vs control mice or for indicated comparisons

