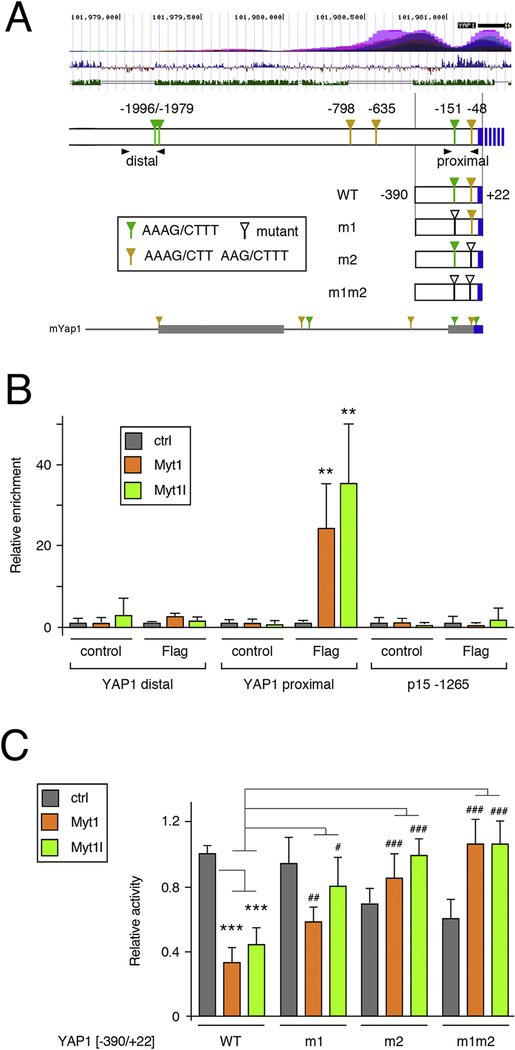
Figure 6. Direct regulation of YAP1 by Myts.
A) The human YAP1 upstream region is shown schematically. Above is a screenshot from the USCS genome browser showing H3K27Ac ChIP-seq signal (top), vertebrate conservation (middle) and identity with mouse (lower track). The positions of the MYT consensus sites are shown, relative to the transcriptional start, together with the four luciferase constructs generated. Arrowheads indicate the positions of the PCR primer pairs for ChIP. Below is the region from the mouse Yap1 gene, with two blocks of high sequence identity shown as thicker bars. Consensus MYT sites in mYap1 are marked. B) Binding of Myt1 and Myt1l was analyzed by ChIP-qPCR from U87 cells with either Flag-Myt1, Flag-Myt1l or a control vector. Binding to the proximal and distal regions of the YAP1 promoter was analyzed, together with a negative control region from the CDKN2B gene. Average plus sd of quadruplicate IPs. p-values were determined by Student’s T-test: ** p < 0.01, for comparison to the IP from control cells. C) Luciferase activity of the four constructs shown in A was analyzed in U87 cells expressing Flag-Myt1, Flag-Myt1l or in control cells. p-values were determined by Student’s T-test, with correction for multiple testing: *** p < 0.001, for comparison of WT reporter activity to the control cells, # p < 0.05, ## p < 0.01, ### p < 0.001 for comparison of the mutant reporters to the WT in Myt1 or Myt1l expressing cells. For C, a single representative experiment is shown, from two repeats, with average and s.d. of six replicates. Data in panel B is from a single experiment, with average and s.d. of four replicates.

