
Figure 4.
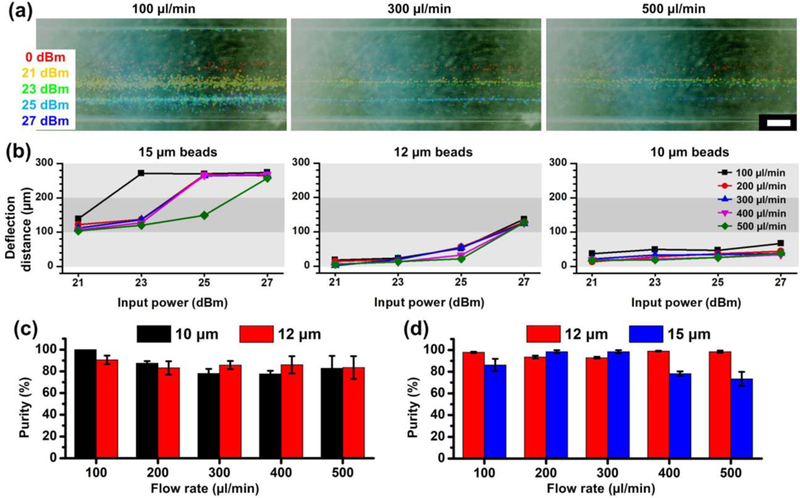
The lateral shift in particle trajectories in the 3D-AFT device. (a) 15 µm particles migrate laterally via 3D-AFT separation device and the distance varies due to different input power amplitudes and flow rates. (b) Plots of the correlations between the deflection distance and the input power at various flow rates (n=1). Scale bar: 200 µm. (c) Separation performance of 10 µm / 12 µm particles and (d) 12 µm / 15 µm particles. The purity of outputs are characterized. The data is presented as average ± standard error (n=3).