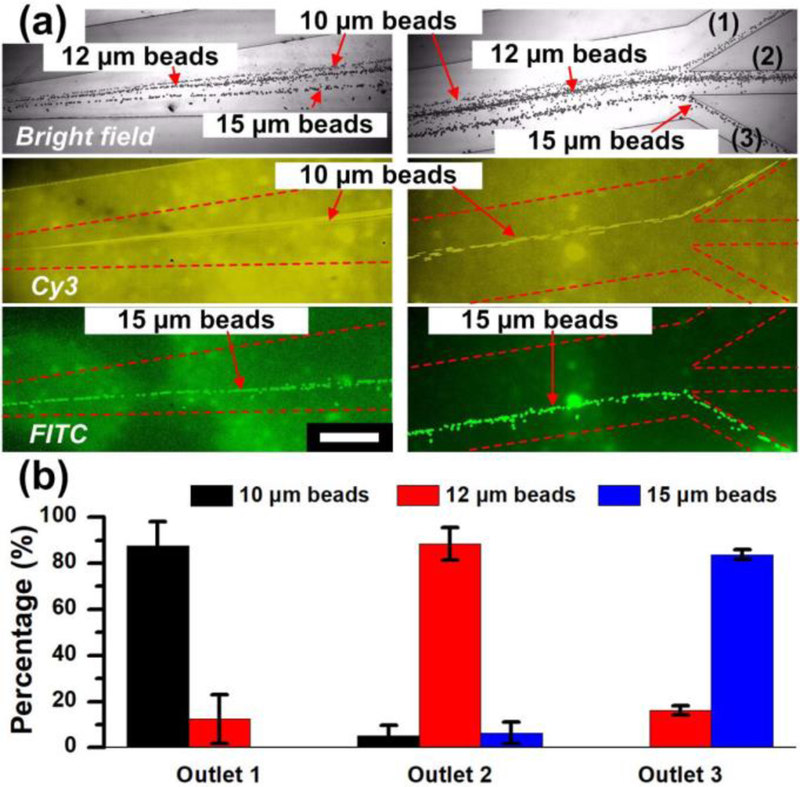
Figure 6.

Acoustofluidic separation of multiple fractions of different sized particles via 3D-AFT. (a) Stack images from video frame captures of bright field and two fluorescent fields show the trajectories of 10 µm (Cy3 conjugated), 12 µm and 15 µm (FITC conjugated) polystyrene beads. Scale bar: 500 µm. (b) Percentage of different sized beads collected from the three outlets. The data is presented as average ± standard error (n=3).
