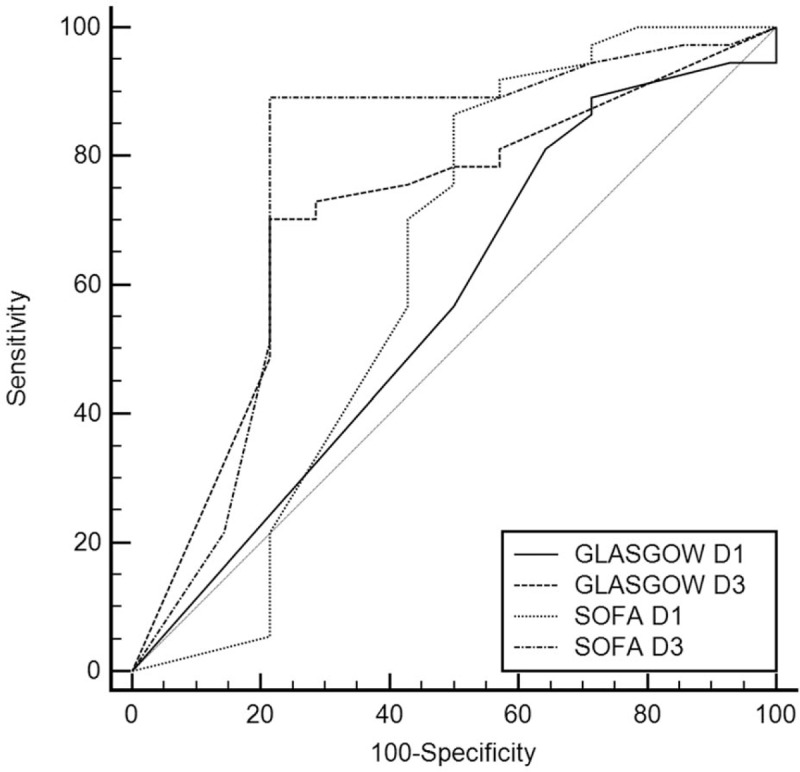
Figure 2.

Comparison of ROC curves of GCS and SOFA on D1 and D3. GCS = Glasgow Coma Scale, ROC = receiver-operating characteristic, SOFA = Sequential Organ Failure Assessment.

Comparison of ROC curves of GCS and SOFA on D1 and D3. GCS = Glasgow Coma Scale, ROC = receiver-operating characteristic, SOFA = Sequential Organ Failure Assessment.