
Figure 2.
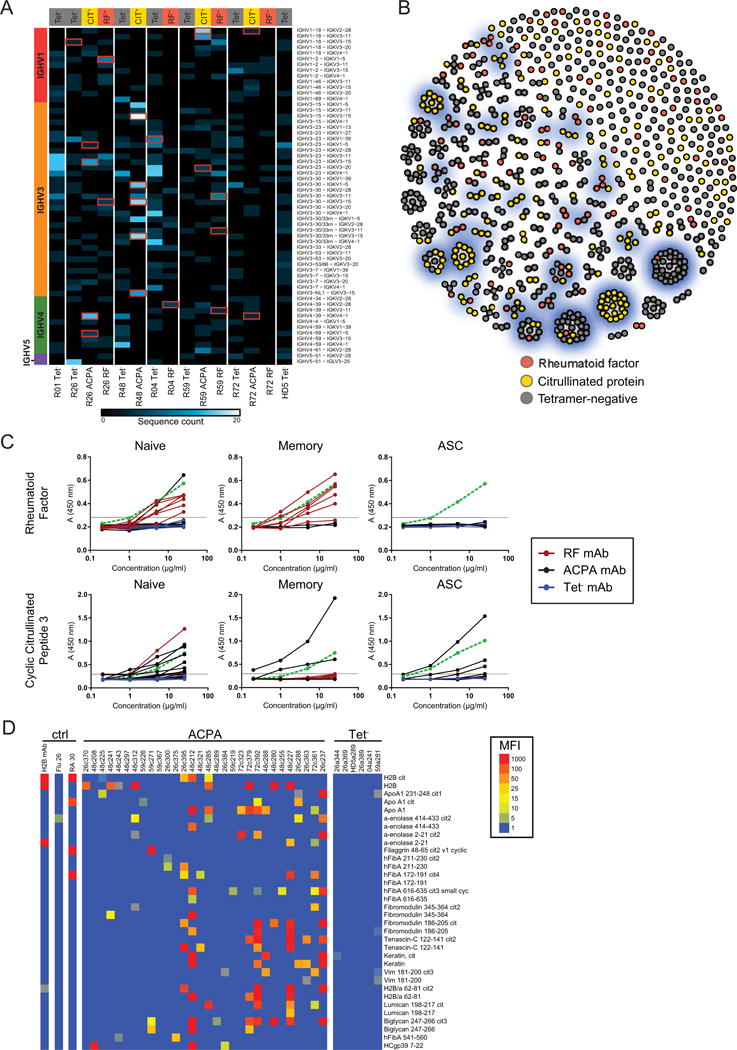
RF and ACPA B cells exhibit distinct immunoglobulin gene usage and CDR3 convergence. (A) Heatmap showing most frequently utilized VH-VL pairs for each patient’s CIT-Tetramer+ (CIT-Tet+), RF-Tet+, and Tet− populations. Column labels denote antigen-specific populations arranged by patient. Row labels denote VH-VL pairs arranged by VH gene family. Red boxes identify prominent VH-VL pairs from which recombinant antibodies were expressed. (B) Greedy, agglomerative clustering of single B cells with H.CDR3 and L.CDR3 sequences sharing >80% homology. Each cell, colored by antigen specificity, is a node. Gray edges connect cells belonging to the same cluster. Prominent clusters from which recombinant antibodies were expressed are highlighted in blue. (C) Representative ELISA results (n=3) against RF and cyclic-citrullinated peptide 3 for all recombinant antibodies, measured using absorbance values, and plotted by B cell subtype as determined by BCellNet. Antibodies expressed from RF, ACPA, and Tet− B cells are represented using red, black, and blue solid lines, respectively. The dotted green line denotes a positive control monoclonal antibody. Threshold for positive reactivity is represented with a horizontal gray line. (D) Top citrullinated autoantigen microarray hits for expressed monoclonal antibodies. Binding intensity is shown for both citrullinated peptides and available corresponding non-citrullinated antigens.