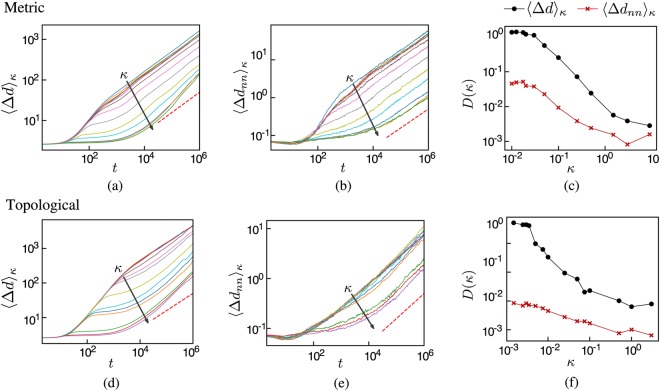
Figure 4.
Average distance between particles 〈Δd〉κ and to the nearest neighbor 〈Δdnn〉κ as functions of time for different values of the average long-range connectivity κ. The short-range interactions were implemented metrically for the top panels, and topologically for the bottom panels. The arrows indicate the direction of increasing κ in the interval [0.0, 9.0] for metric short-range interactions and in the interval [0.0, 1.0] for topological ones. Note that these average distances asymptotically behave as tα (the red dashed line corresponds to α = 1/2), indicating diffusive behavior. The two panels at the right show the diffusion coefficient as a function of κ. As κ increases, the diffusion coefficient decreases several orders of magnitude, showing the effect of the long-range connections on the expansion of the system. The simulations were carried out for systems with N = 4096, η = 0.15 and initial density ρ0 = 0.3.

