Figure 3.
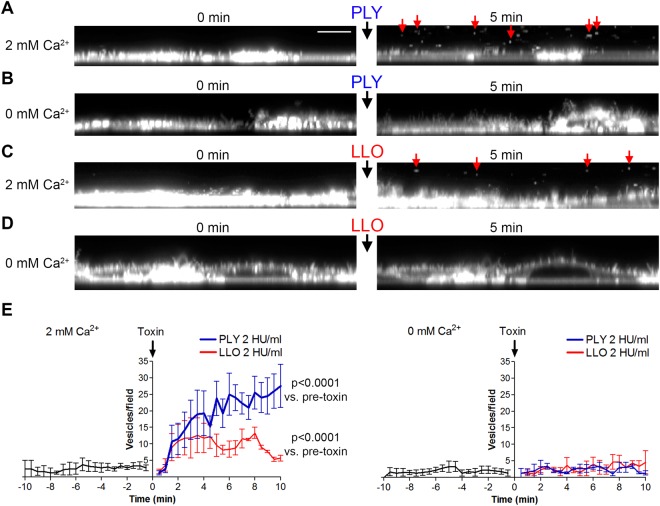
Extracellular vesicle shedding in primary mixed glial cells. Confocal imaging of fluorescent CellMask stained membranes (z-plane reconstruction in panels A–D) at 0 and at 5 min after exposure to toxin. (A) 2 HU/ml pneumolysin (PLY) in 2 mM Ca2+ conditions. Red arrows indicate shed extracellular vesicles. Scale bar: 8 µm. (B) Lack of membrane vesicle shedding after cell challenge with 2 HU/ml PLY in calcium-free conditions. (C) Membrane vesicle shedding (red arrows at 5 min) after challenge with 2 HU/ml listeriolysin (LLO). (D) Inhibited vesicle shedding after challenge with 2 HU/ml LLO. E. Diagrams of the number of vesicles/field (z-plane reconstruction field with the size 60 × 10 µm) before and after toxin challenge at 2 mM Ca2+ (left) and calcium-free conditions (right), clearly indicating the inhibition of vesicle shedding for both toxins in calcium-free conditions. All values represent the mean ± SEM of 5 independent experiments (n = 5). Significance calculated with the Wilcoxon matched pair test with individual time point pairing.

