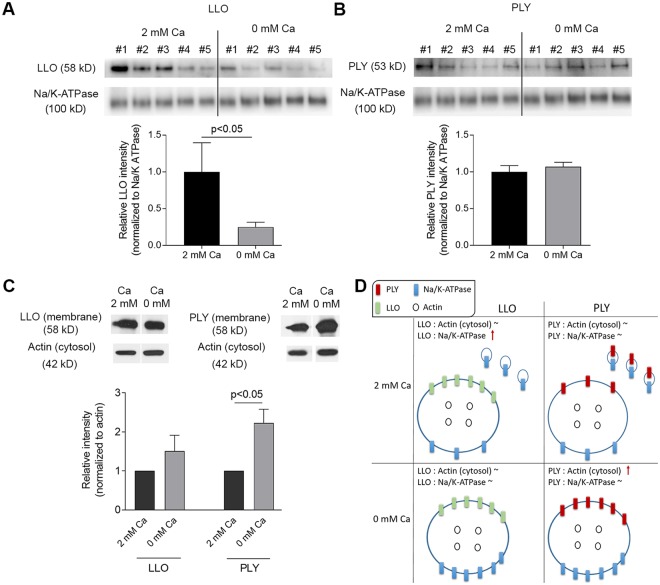
Figure 4.
Western blot analysis of toxin load per membrane and per a cell. (A) Membrane-bound LLO after exposure to 2 HU/ml LLO for 20 min in 2 mM Ca2+ and in calcium-free conditions, normalized to the membrane marker Na/K-ATPase. The drop of LLO in calcium-free conditions indicates more Na/K-ATPase and less LLO is present in shed vesicles. #1 to #5 indicate independent experiments‘ samples. (B) Membrane-bound PLY after exposure to 2 HU/ml PLY for 20 min remains unchanged in 2 mM Ca2+ and in calcium-free conditions, normalized to the membrane marker Na/K-ATPase. This indicates shed vesicles contained proportional amounts of toxin and membrane marker. #1 to #5 indicate independent experiments‘ samples. (C) Membrane toxin load normalized to cytosolic actin (i.e. the number of cells) demonstrating increased load per a cell after calcium depletion for PLY, but not for LLO. (D) Schematic explanation of the results when normalizing to a membrane and to a cytosolic protein. All values represent mean ± SEM of 5 or 6 independent experiments (n = 5–6). All bands of interest are cropped from the source blots, as lines of cropping are indicated with dotted line. All loading controls with actin and Na/K-ATPase correspond to the identical samples with LLO or PLY staining in the same panel of the figure. Source blots in unprocessed form are included in Supplementary Figures S2–S4. Analysis is performed using the Wilcoxon matched pair test.

