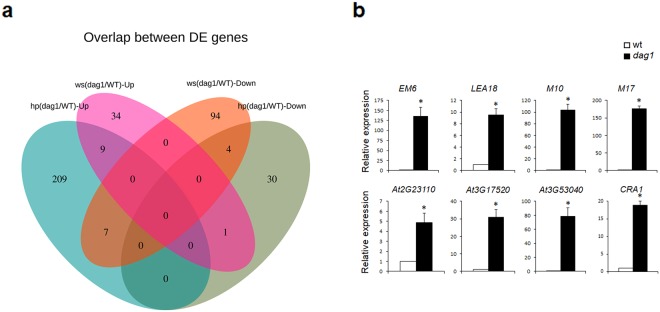
Figure 8.
Venn diagram for the up- and down-regulated genes. (a) Venn diagram of the hp dag1/WT and ws dag1/WT up- and down-regulated DE genes. (b) Expression analysis of the M17, CRA1, EM6, LEA18, M10, At2g23110, At3g17520, and At3g53040 DE genes in dag1 and wild type hypocotyls under continuous monochromatic red light (40 μmolm−2s−1). RT-qPCR assays were performed with 1 μl of the diluted cDNA, along with the specific primers, listed in Supplementary Table S3. Relative expression levels were normalized with UBQ10 (At4g05320) reference gene. The values of relative expression levels are means of three biological replicates, presented with SD values. Significant differences were analyzed by t-test (*P ≤ 0,05).

