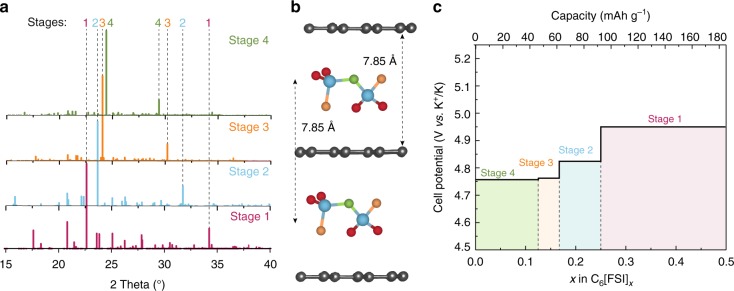
Fig. 2.
DFT calculations of FSI− anion intercalation into graphite. a Simulated powder XRD patterns of charged graphite with intercalated FSI− anions in different stages. The dashed lines represent the positions of the most intense peaks for stages 1, 2, 3, and 4. For stage 1, the peak at 2θ = 20.81° corresponds to the (0k0) plane, due to the lateral shift of graphite layers (AB stacked) upon FSI− intercalation in the fully charged system. As there is much less shift of AB-stacking for other stages (stages 2, 3, and 4), we did not find any additional peaks for these systems (see Supplementary Fig. 8 and Note 3 for detailed explanation). b Schematic of FSI− anion intercalated into graphite for stage 1 (n = 1). Fluorine, oxygen, sulfur, and nitrogen atoms representing FSI− anion are shown in brown, red, blue, and green colors, respectively. c Calculated voltage profile of FSI− anion intercalation into graphite as a function of the molar ratio between FSI− and C (i.e., x in C6[FSI]x)

