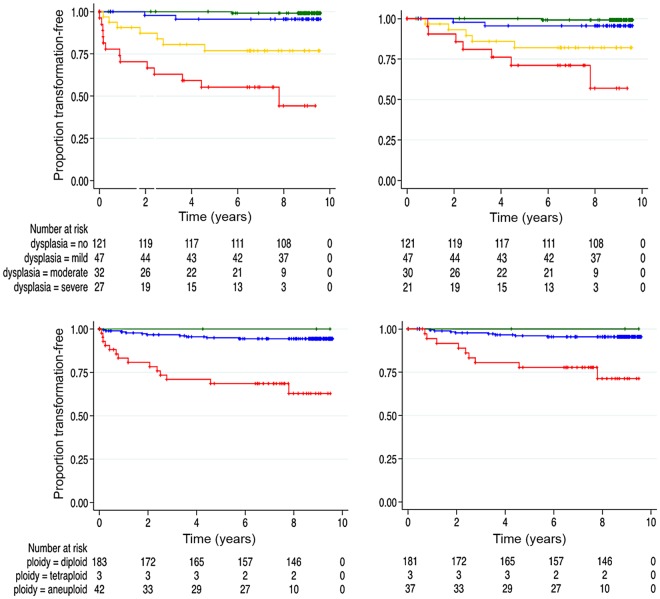
Figure 2.
Kaplan Meier curves for malignant transformation. Upper panel. Progression-free proportion by dysplasia grade including (left) and excluding (right) malignant transformation within 6 months of diagnosis of the index lesion (dysplasia grades green, none; blue, mild; amber, moderate; red, severe). Lower panel. Progression-free proportion by DNA ploidy status including (left) and excluding (right) transformation within 6 months of diagnosis of the index lesion (ploidy diagnosis green, diploid; blue, tetraploid; red, aneuploid). The number of patients still at risk at selected time points (x-axis) is shown below each plot. The difference in time to progression for different grades and DNA ploidy status were statistically significant, log rank test p ≤ 0.001.

