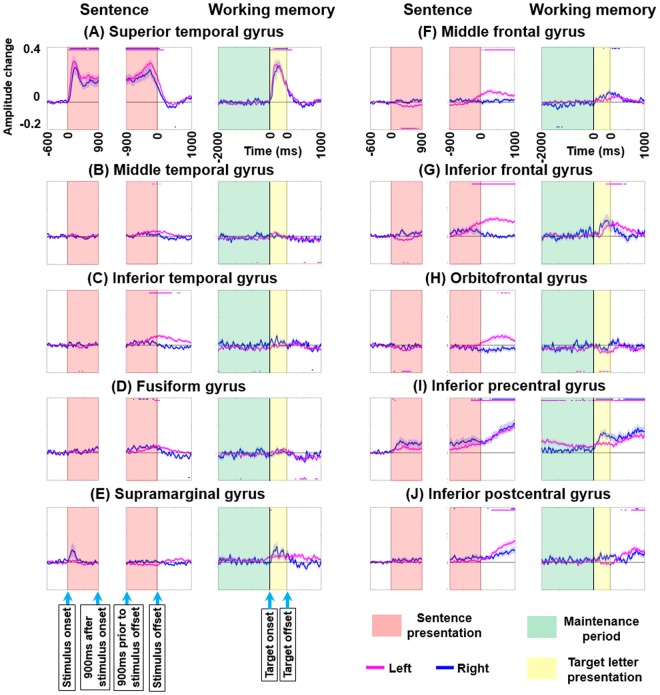
Figure 4.
High-gamma dynamics during auditory naming and working memory tasks. Mean high-gamma activity at (A) superior-temporal gyrus (STG), (B) middle-temporal gyrus (MTG), (C) inferior-temporal gyrus (ITG), (D) fusiform gyrus (FG), (E) supramarginal gyrus (SMG), (F) middle-frontal gyrus (MFG), (G) inferior-frontal gyrus (IFG), (H) orbitofrontal gyrus (ORB), (I) inferior-precentral gyrus (iPreCG), and (J) inferior-postcentral gyrus (iPoCG). +0.1 indicates 10% increase compared to the baseline value. Red line: left hemisphere. Blue line: right hemisphere. Standard error bars are shown. Horizontal bars above and below: periods with significant high-gamma augmentation and attenuation, respectively. Duration of target letter presentation: 500 ms.

