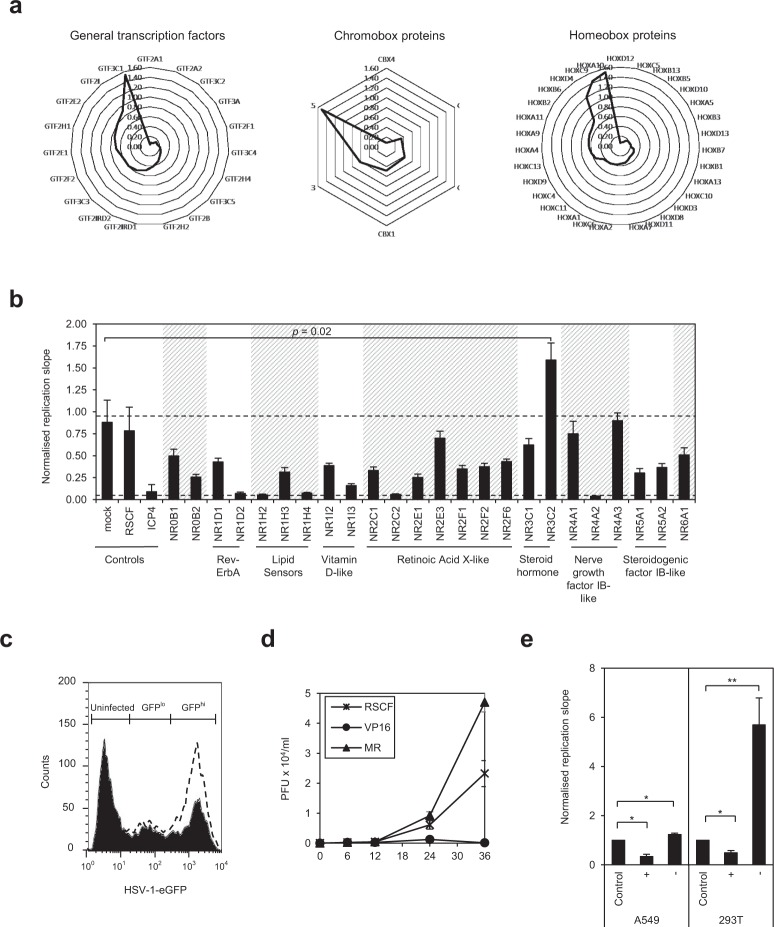
Figure 1.
The MR (NR3C2) is anti-viral to HSV-1. (a) DNA-binding and transcription factors of the general transcription factor (GTF), chromobox (CBX) and homeobox (HOX) protein families affecting HSV-1 replication. HeLa cells were transfected with gene-specific siRNA before infecting with HSV-1-eGFP (MOI 0.5). Replication was monitored as a function of GFP fluorescence, and the slopes of replication during the linear phase were calculated, normalized to controls (average of mock and RSCF-transfected cells) and depicted by radar plots. (b) Depletion of the nuclear receptor NR3C2 enhances HSV-1 replication. HeLa cells were transfected with gene-specific siRNA and infected with HSV-1-eGFP (MOI 0.5). Replication was monitored and normalised as described. —cut-off for top 2.5% inhibitory (slope 0.05) and enhancing (slope 0.95) hits. Error bars represent the standard deviation of the mean of three independent experiments carried out in duplicates. p-value was calculated using an unpaired t-test for unequal variances. (c) Flow cytometric analysis of MR-depleted HSV-1-infected HeLa cells. Mock-transfected (solid line) or MR-specific siRNA-transfected (dashed line) HeLa cells were infected with HSV-1-eGFP (MOI 1) and GFP-positive cells quantified by flow cytometry 24 hr post-infection. (d) The MR is anti-viral to HSV-1. HeLa cells were transfected with negative control (RSCF), positive control (VP16) or MR-specific siRNA, and virus titre in supernatant harvested after 0, 6, 12, 24, and 36 hr post-infection was quantified by plaque assay on Vero cell monolayers. Graph represents an average virus quantity, in plaque-forming units (PFU) × 104 per ml, from three experiments carried out in duplicate. (e) A549 or 293T cells overexpressing (+) or depleted for (−) MR were infected with HSV-1 (MOI 0.5) and replication monitored by GFP fluorescence. Slopes of replication over the linear phase were calculated and normalised to control (pCR3 or RSCF siRNA-transfected cells). Error bars represent the standard error of three independent experiments carried out in triplicates. p-values were calculated by unpaired two-tailed t-test for unequal variances. *p = 0.002; **p < 0.001.

