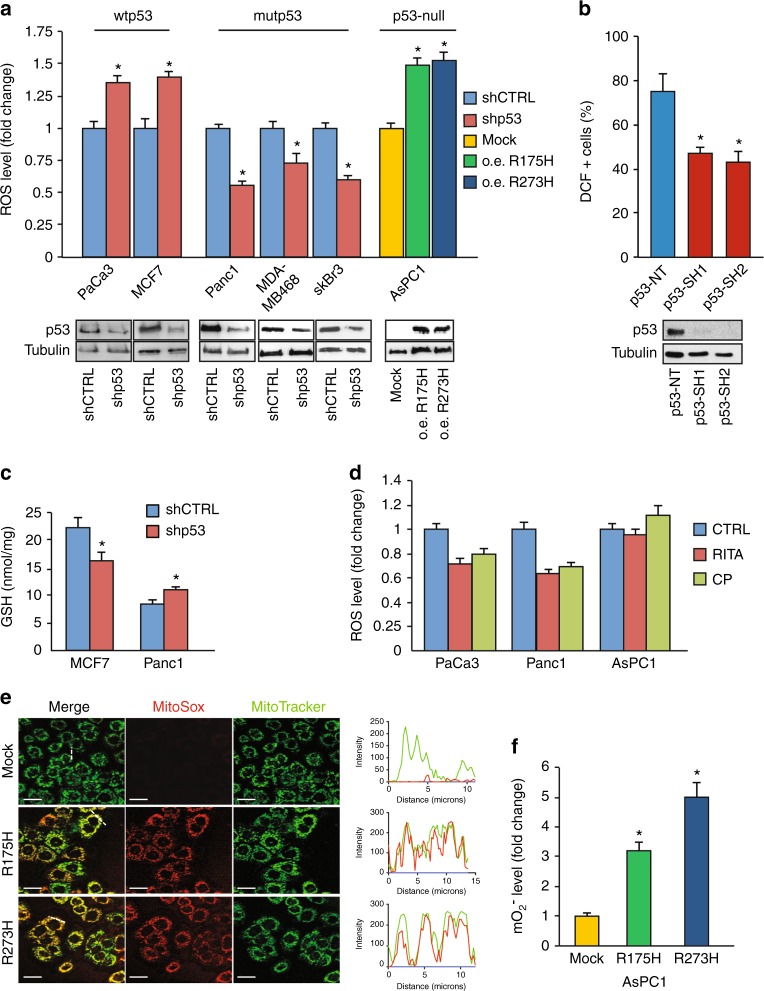
Fig. 1.
Mutant p53 proteins enhance ROS production in cancer cells. a The indicated cell lines were seeded in 96-well plates, incubated overnight, and transfected with the pRSuper-p53 vector and with plasmids for overexpression of mutant p53 (o.e. R175H; o.e. R273H), or their relative negative mock control (CTRL). DCF fluorescence intensity was analyzed by a multimode plate reader. Western blot of p53 was performed to test the effective knockdown of WT or mutant p53 and the overexpression of mutant p53 in the various cell lines indicated. b MDA-MB-231 cells stably silenced for p53 by lentiviral transduction with two different short hairpin sequences, were treated for 15 min with the ROS probe CM-H2DCFDA and then analyzed by FACS. Bars represent average (± SEM) of the percentage of DCF positive (+) cells measured by FACS from two independent biological experiments performed in technical duplicate. Statistically significant differences are indicated: *p < 0.05, ** p < 0.001. Western blot of p53 was performed to test the effective knockdown of mutant p53. c The intracellular oxidized and reduced glutathione were determined in MCF7 and Panc1 mutR273H-p53 cell lines after transient transfection with the pRsuper-p53 vector. d The indicated cell lines were seeded in 96-well plates, incubated overnight, and treated with 20 µM CP-31398 or 40 µM RITA for 48 h. DCF fluorescence intensity was measured by a multimode plate reader. e Live cell imaging: 48 h after transfection with plasmid coding for R175H or R273H mutant p53, or with the mock vector (CTRL), cells were incubated for 30 min with MitoSox probe (red) and Mitotracker Green (green). The RGB profile plotted along the dashed line drawn in the merge image is also shown. Merge and single channel images come from a single z-plane. Scale bar 10 μm. f Mitochondrial superoxide evaluation by MitoSox Red probe was analyzed with a multimode plate reader. Cells were seeded in 96-well plates, incubated overnight, and transfected with plasmid coding for R175H or R273H mutant p53, or the mock vector. All the experiments presented in this figure are representative of three biological replicates. P values were calculated with two-tailed t test. Statistical analysis: *p < 0.05

