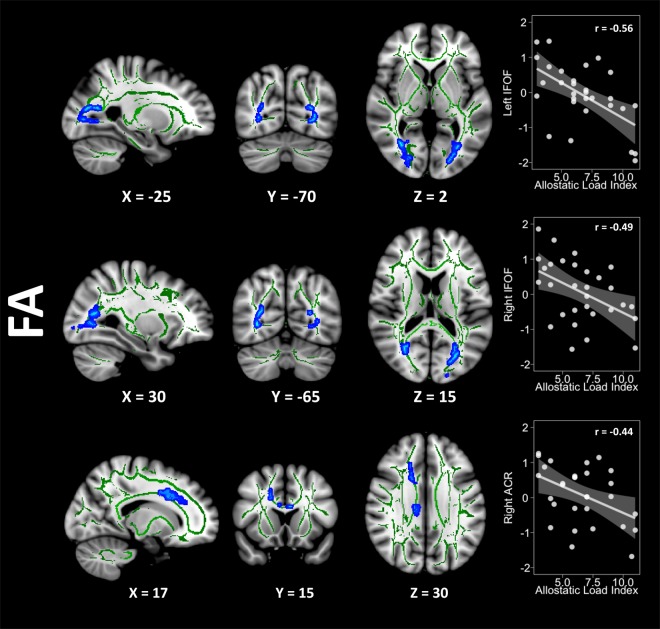
Figure 1.
Decreasing FA values regarding the AL index increase are represented in blue. The Y-axis in the scatterplots depicts the standardised residual (regressors: age, sex, and WtHR) of the FA average score within the cluster. The X-axis represents the AL index scores. Please note that correlation coefficients only intend to complement scatterplots visualisation. FA = fractional anisotropy, WtHR = waist-to-height ratio, IFOF = inferior fronto-occipital fasciculus, ACR = anterior corona radiata.

