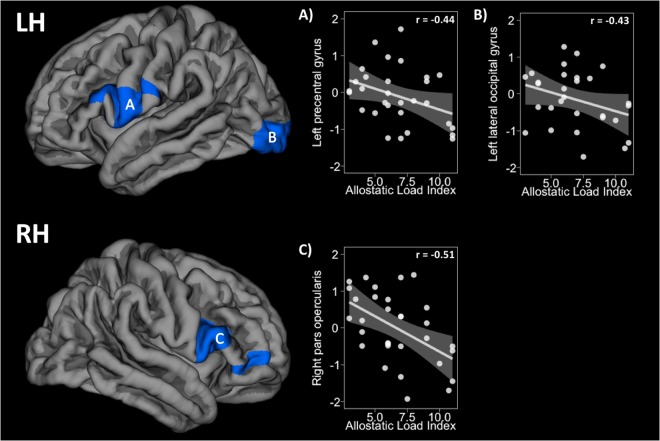
Figure 3.
The first row shows the density reductions in the left hemisphere regarding AL increase in (A) the left precentral gyrus and (B) the left lateral occipital pole. The second row shows reductions in the (C) right pars opercularis. The Y-axis in the scatterplots depicts the standardised residual (regressors: age, sex, and WtHR) of the cluster average volume. The X-axis represents the AL index scores. Please note that correlation coefficients only intend to complement scatterplots visualisation. LH = left hemisphere, RH = right hemisphere, WtHR = waist-to-height ratio.

