Fig. 1.
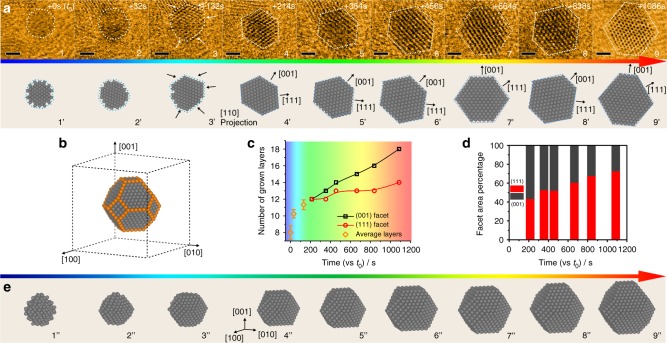
Shape evolution of the growing Pt3Ni nanoparticle. a In situ STEM images of one growing Pt3Ni nanoparticle (upper row) and corresponding 2D projection model (lower row), scale bar: 1 nm. b Representative atomic model (not to scale) of the nanoparticle during growth. c Number of grown layers of the (001) and (111) facets (Error bars correspond to standard deviations of at least three independent layer estimation) and d their surface exposure ratio as function of experimental time. e 3D model (not to scale) of the Pt3Ni growth process. The early stage model 1” is only constructed to show a possible dynamical cluster structure

