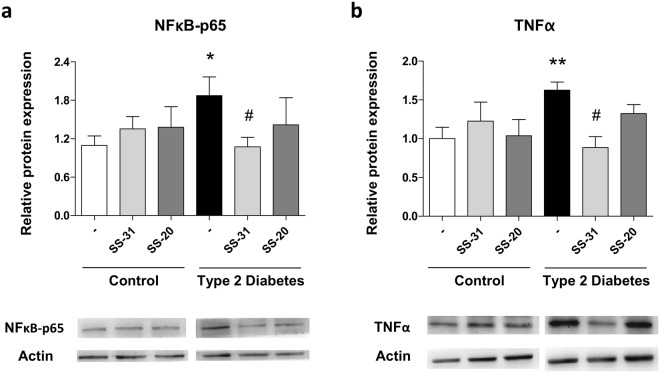
Figure 4.
Effects of SS-31 (30 min, 100 nM) on protein expression of NFκB-p65 and TNFα in type 2 diabetic patients and control subjects (a) Protein levels of NFκB-p65 and representative WB images (b) Protein levels of TNFα and representative WB images. Control samples and T2D samples derived from the same experiment on the one hand and blots on the other were processed in parallel. **p < 0.01 with regard to control group #p < 0.05 vs. non-treated T2D group.

