Fig. 1.
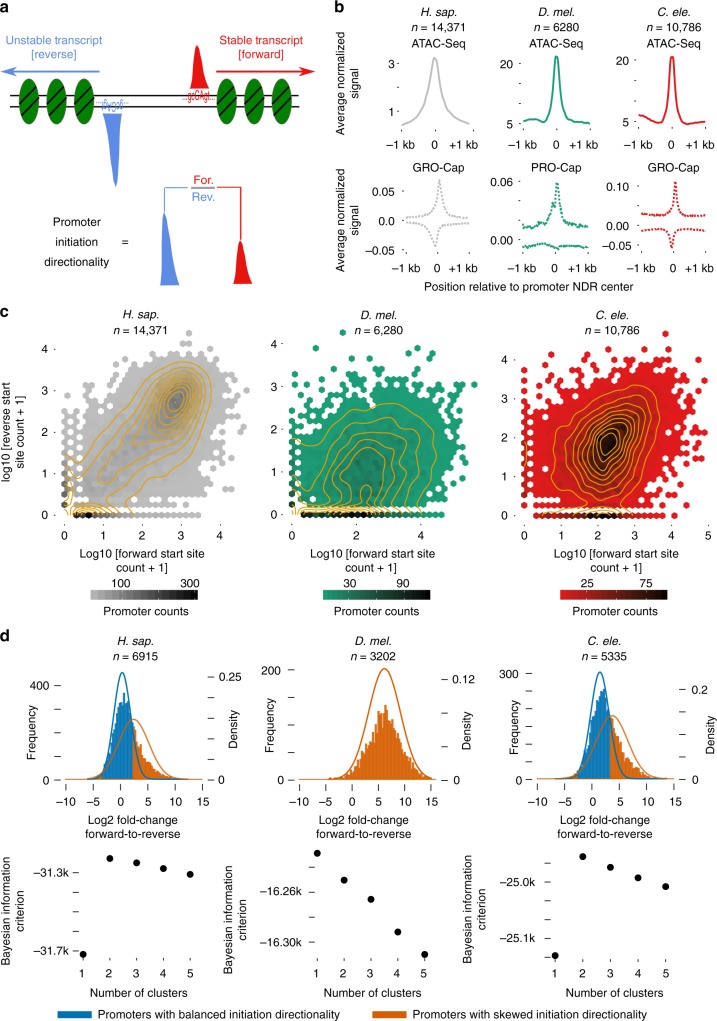
Variation of promoter initiation directionality. a Schematic of divergent transcription initiation from promoter regions. b Average depth-normalized ATAC-seq (solid line) coverage and zero-to-one-scaled PRO/GRO-cap (dotted line) coverage relative to promoter NDR midpoints as defined by ATAC-seq. c Forward direction (annotated gene) vs. reverse direction PRO/GRO-cap counts displayed as contour and hexbin scatter plots for the same promoter NDRs as b. d Mixture model (top) and Bayesian Information Criterion analysis of cluster numbers (bottom) for forward/reverse PRO/GRO-cap count ratios for promoter NDRs containing significant forward initiation. A pseudo count of 1 was added to numerators and denominators. Lines represent density of theoretical Gaussian distributions learned from the data, histograms represent observed ratios

