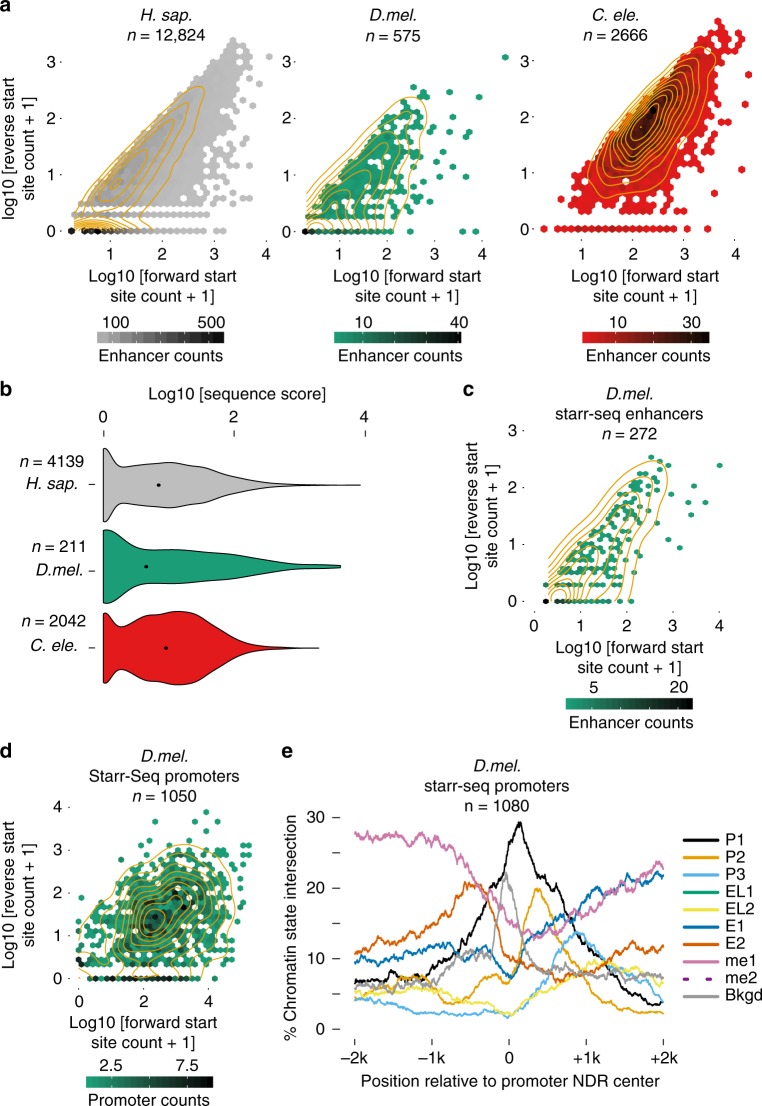
Fig. 4.
Genuine transcription initiation from distal enhancers. a Contour/hexbin scatter plots of forward vs. reverse direction PRO/GRO-cap counts for ATAC-seq-defined intergenic NDRs, which intersected at least H3K4me1 and H3K27ac in H. sapiens GM12878 (left), D. melanogaster S2 cells (middle) and whole L3 C. elegans (right). Forward and reverse are the strands with higher and lower counts, respectively. b Core promoter sequence model scores at enhancers with significant forward and/or reverse TSS modes (see Methods). Forward and reverse TSSs are plotted together. Numbers indicated in the figure refer to the number of enhancer regions. Total TSSs measured are 5588 (H. sap.), 267 (D. mel.), and 3062 (C. ele.). Black dots represent median values. c Forward vs. reverse direction PRO-cap counts for intergenic NDRs that intersect STARR-seq peaks and have at least one count on one strand. d Forward vs. reverse direction PRO-cap counts for promoter NDRs that intersect STARR-seq enhancer peaks and have at least one count on one strand. e Chromatin state coverage plots for promoter NDRs that intersect STARR-seq enhancer peaks

