Figure 3.

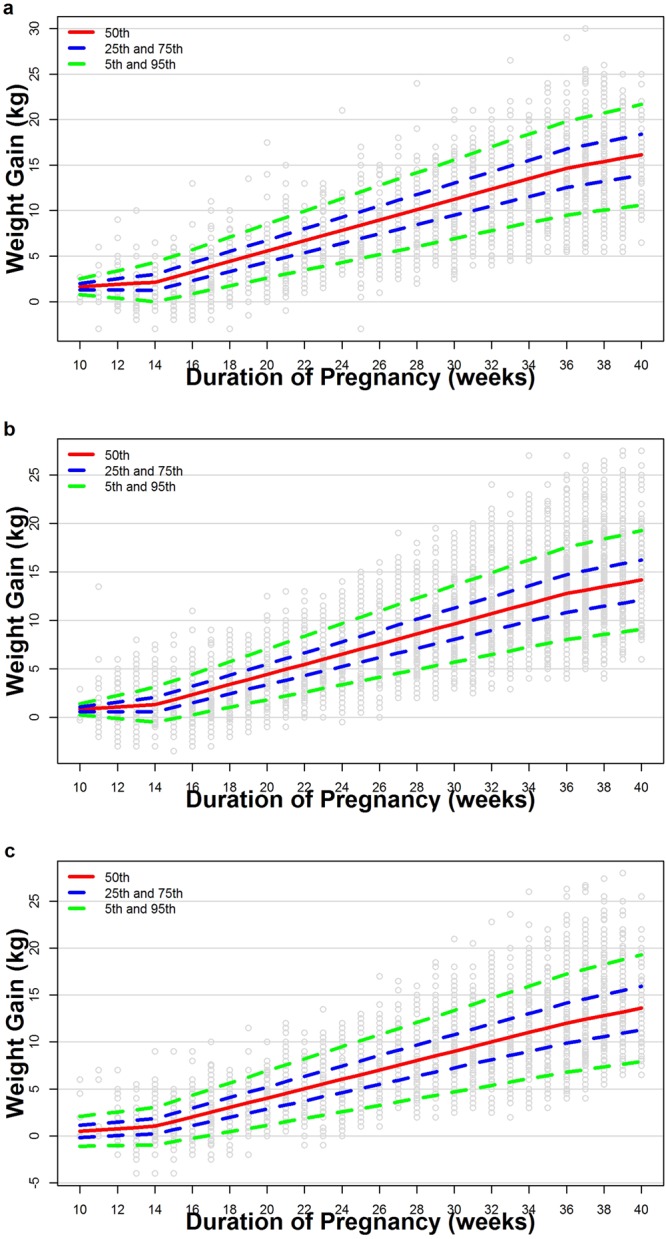
(a–c) Estimated trajectories at 5th, 25th, 50th, 75th, and 95th centiles of weight over gestational weeks among underweight (a), normal weight (b), and overweight (c) women. Small grey circles are actual observations.

(a–c) Estimated trajectories at 5th, 25th, 50th, 75th, and 95th centiles of weight over gestational weeks among underweight (a), normal weight (b), and overweight (c) women. Small grey circles are actual observations.