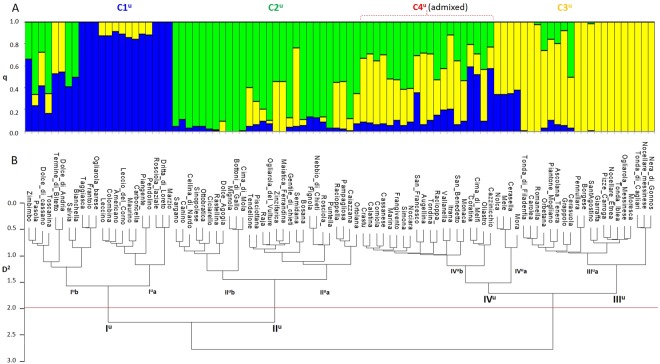
Figure 2.
Genetic diversity assessment of 94 Olea europaeae cultivars using 8,088 high-quality SNP markers called by TASSEL-UNEAK (u). (A) Bar-plot describing population structure estimated by STRUCTURE. Population was divided into three clusters plus a cluster of admixed cultivars (C4u). Each bar is separated into K coloured segments each representing the ancestry qi proportion in each individual. (B) AWclust dendrogram plot showing four main sub-populations. D2 indicates allele sharing distance.

