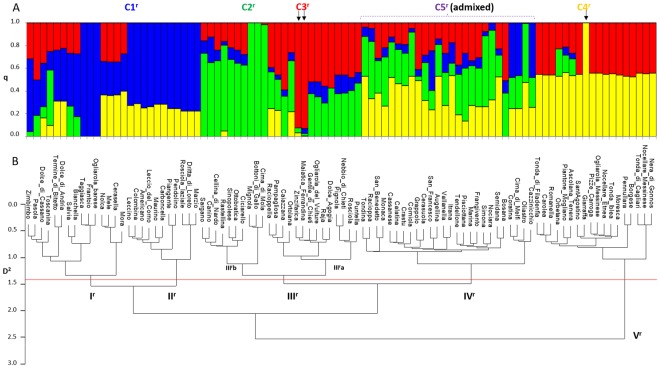
Figure 3.
Genetic diversity assessment of 94 Olea europaeae cultivars using 22,088 high-quality SNP markers called by TASSEL-GBS (r). (A) Bar-plot describing population structure estimated by STRUCTURE. Population was divided into four clusters plus a cluster of admixed cultivars (C5r). Each bar is separated into K coloured segments each representing the ancestry qi proportion in each individual. Black arrows indicate bars corresponding to cultivars included in clusters C2 and C3. (B) AWclust dendrogram plot showing five main sub-populations. D2 indicates allele-sharing distance.

