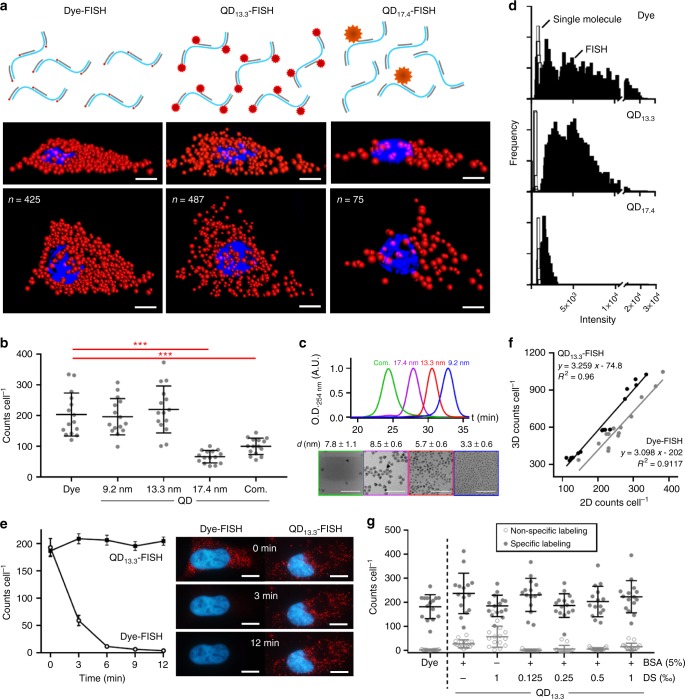
Fig. 1.
Fluorescence in situ hybridization (FISH) using dye labels or quantum dot (QD) labels with diverse sizes. Data show HeLa cells stained for glyceraldehyde-3-phosphate dehydrogenase (GAPDH) transcripts. a Schematics show RNA target labeling density; representative 3D deconvolved epifluorescence images show cells in two orthogonal orientations, using dyes, small QDs (13.3 nm), or big QDs (17.4 nm). Scale bar = 8 μm. b FISH transcript counts (2D) using dyes, custom designed QDs with three hydrodynamic diameters (9.2, 13.3, or 17.4 nm), or commercially available QDs (com.). Asterisks indicate: p ≤ 0.05 (*), p ≤ 0.01 (**), and p ≤ 0.001 (***); Student’s t-test. N = 15. Comprehensive statistical comparisons are provided in Supplementary Table 2. c Gel permeation chromatograms and TEM images (with core size) of the four QDs from panel b. Scale bar = 50 nm. d Intensity histograms of FISH spots for dyes, small QDs (13.3 nm), and big QDs (17.4 nm) are shown in black compared with histograms of single-fluorophore intensities in white. e FISH counts after different times of laser excitation, comparing stability of QD13.3 and dyes, including representative images. Scale bars = 10 μm. N = 15. f Correlation between FISH counts in 2D and 3D images for QD13.3 and dye labels. Comprehensive statistical comparisons are provided in Supplementary Table 1. g Impact of customized blocking conditions on specific and nonspecific labeling. Nonspecific labeling counts (2D) for QDs were statistically the same as those of background when applying both 5% bovine serum albumin (BSA) and 0.125‰ dextran sulfate (DS). N = 15. All error bars represent s.d

