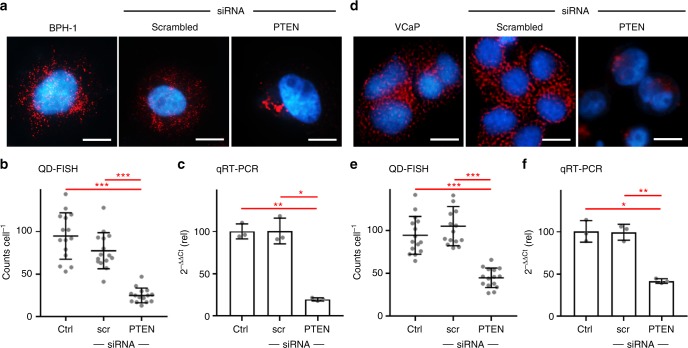
Fig. 3.
QD-FISH analysis of phosphatase and tensin homolog (PTEN) transcripts in prostate cancer cell lines. Representative images show BPH-1 cells (a) and VCap cells (d) with or without treatment by siRNA to knock down PTEN expression, or using a scrambled siRNA sequence. Scale bar = 10 μm. Single-cell QD-FISH counts are shown for (b) BPH-1 cells and (e) VCaP cells, in comparison with transcript measurements by population qRT-PCR for (c) BPH-1 cells and (f) VCap cells. Significantly reduced mRNA levels are observed for anti-PTEN siRNA treatment, with a similar magnitude between QD-FISH and qRT-PCR. Asterisks indicate: p ≤ 0.05 (*), p ≤ 0.01 (**), and p ≤ 0.001 (***); Student’s t-test. All error bars represent s.d. N = 15 for (b) and (e), N = 3 for (c) and (f). Comprehensive statistical comparisons are provided in Supplementary Tables 4–7. PTEN mRNA FISH probe sequences are shown in Supplementary Table 8

