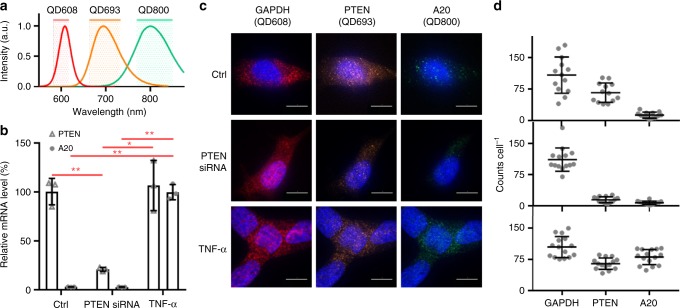
Fig. 4.
Multiplexed QD-FISH quantification of three transcripts in single LNCaP cells. The three transcripts include GAPDH, PTEN, and A20. a Emission spectra of QD608, QD693, and QD800 and corresponding emission bandpass filters used for imaging. b Graph shows the expressions of PTEN and A20 transcripts relative to GAPDH by qRT-PCR after cells were exposed to either anti-PTEN siRNA to knock down PTEN expression or TNF-α to induce A20 expression. Asterisks indicate: p ≤ 0.05 (*), p ≤ 0.01 (**), and p ≤ 0.001 (***); Student’s t-test. N = 3. c Representative QD-FISH images of single cells in each color channel corresponding to bandpass filters shown in panel a. QD probes were specific against GAPDH (QD608), PTEN (QD693) or A20 (QD800), and cells were treated with or without anti-PTEN siRNA or TNF-α. Scale bar = 10 μm. d Single-cell QD-FISH results are shown for GAPDH, PTEN and A20 transcripts for each of the three experimental conditions corresponding to the images in panel c. N = 15. All error bars represent s.d. A20 mRNA FISH probe sequences are shown in Supplementary Table 9

