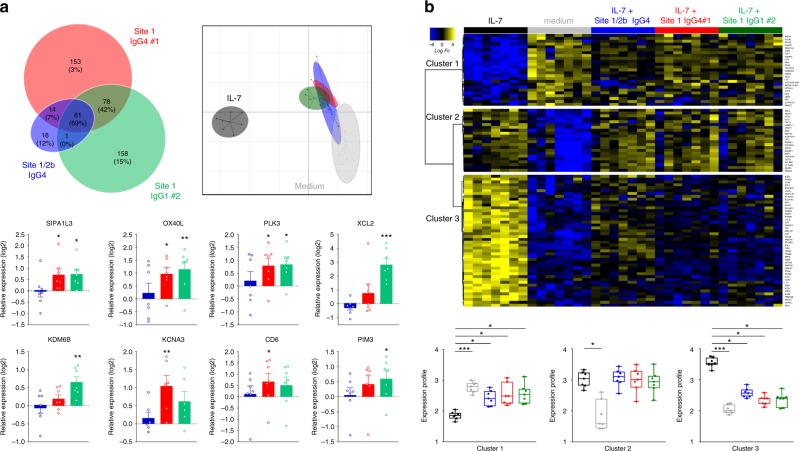
Fig. 4.
Dual agonist/antagonist (site-1) anti-IL-7Rα mAbs induce transcriptional modification and activation of human leukocytes. a RNA-Seq analysis of human PBMCs (n = 7) incubated without IL-7 for 3.5 h with different anti-human IL-7Rα mAbs (10 µg/ml, blue: site-1/2b IgG4, red: site-1 IgG4#1, green: site-1 IgG1#2). Upper left: Venn diagram of the 481 differentially expressed genes (FDR 5%, FC > 1.5) comparing anti-IL-7Rα mAbs and medium control conditions. Upper right: Principal component analysis (PCA) of anti-IL-7Rα mAbs versus control and IL-7 stimulation (5 ng/ml) on the 93 most differentially expressed genes (FDR 5%, FC > 2) comparing IL-7 stimulation and control conditions. Bottom: Relative expression (fold-change as compare to control medium condition) of selected genes with each anti-IL-7Rα mAb (blue: site-1/2b IgG4, red: site-1 IgG4#1, green: site-1 IgG1#2). *p < 0.05; **p < 0.01; ***p < 0.001 as compare to control medium condition. b RNA-Seq analysis of human PBMCs (n = 7) incubated with IL-7 (5 ng/ml) for 3.5 h with the different anti-human IL-7Rα mAbs (10 µg/ml). Upper: Heatmap of the expression of the 93 most differentially expressed genes (FDR 5%, FC > 2) between IL-7 stimulation and control condition. Bottom: Quantification of the median profile of the three IL-7 induced clusters in IL-7 stimulated, control and IL-7 + anti-human IL-7Rα mAbs conditions. Same colors as in (a). *p < 0.05; **p < 0.01; ***p < 0.001 between indicated groups

