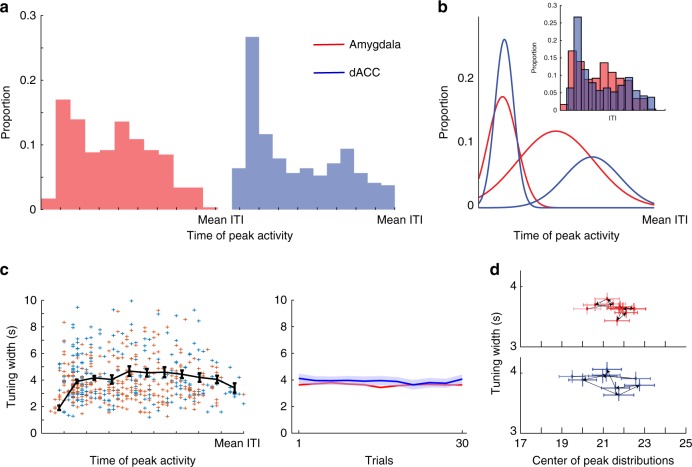
Fig. 6.
Peak activity during the ITI is differentially distributed. a Histograms of the locations of single-unit peak activity for both regions. b Fitted gaussians for the histograms shown in a; inset shows the two distributions overlaid. Amygdala: SSE = 0.0025, r2 = 0.8111 and SSE = 0.0011, r2 = 0.9238; dACC: SSE = 0.0152, r2 = 0.5695 and SSE = 5.3466e-04, r2 = 0.7565. c Left: tuning width of individual cells plotted against the time of peak activity for amygdala (red) and dACC (blue) cells, with mean ± S.E.M. (black). Middle: the average width did not change during acquisition (one-way ANOVA; amygdala: df = 10, f = 1.2, p > 0.28; dACC: df = 10, f = 1.78, p > 0.059; t-test for between-area difference, p > 0.07). d Mean tuning-width (from c) against mean peak location (from a) for all cells, shown for bins of five trials during acquisition (one-way ANOVA; amygdala: df = 10, f = 0.96, p > 0.46; dACC: df = 10, f = 1.58, p > 0.1; t-test for between-area difference, p < 0.001). Both parameters showed stability during learning. Single units: amygdala: n = 101; dACC: n = 89

