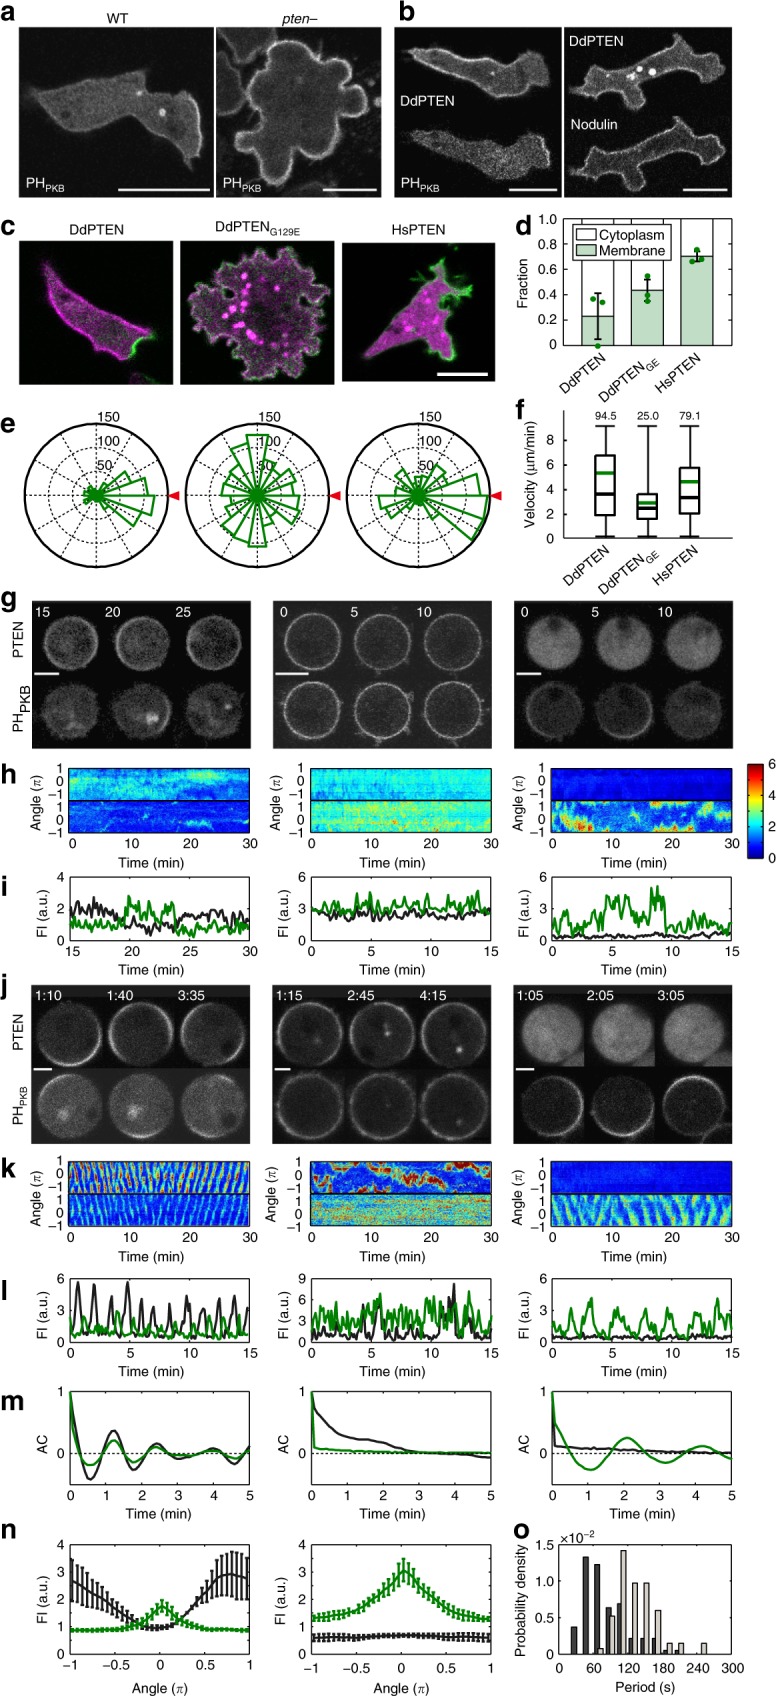
Fig. 1.

Membrane localization of PTEN is critical for the confinement of PIP3 enrichment and cell motility. a Confocal images of living wild-type (left) and pten-null (right) cells expressing PHPKB-eGFP. b Confocal images of living pten-null cells expressing DdPTEN-Halo labeled with TMR and GFP-Nodulin (left) or PHPKB-eGFP (right). c Confocal images of living pten-null cells expressing DdPTEN-Halo (left), DdPTENG129E-Halo (middle) or HsPTEN-Halo (right) and PHPKB-eGFP. d Quantification of PIP3 levels in the cells in c by western blot with anti GFP antibody. The means ± SDs of the ratio of the supernatant fraction to the whole-cell lysate from 3 independent experiments are shown. P = 0.25 and 0.06 (DdPTEN versus DdPTENG129E and HsPTEN) by Welch’s t test. e The pseudopod projection angles from the cells respective to the chemoattractant source (red triangle). Cumulative numbers of membrane protrusion events counted in 15 min in more than 3 cells are shown. f Migration velocity. The box, green and black lines, whiskers and number represent the lower and upper quartiles, mean and median, minimum and maximum and the exact maximum value, respectively. The exact n values are summarized in Supplementary Table 1. g, j Confocal images of latrunculin A-treated pten-null cells expressing DdPTEN-Halo (left), DdPTENG129E-Halo (middle) or HsPTEN-Halo (right) and PHPKB-eGFP in the absence (g) or presence (j) of 4 mM caffeine. Time, min (g) and min:sec (j). h, k Kymographs of the fluorescence intensities measured along the periphery of the cells in g, j, respectively. The intensities were normalized to those measured in the cytoplasm and shown with the indicated color scale. i, l Time series of the fluorescence intensities of TMR (black) and eGFP (green) on the periphery of the cells in g, j, respectively. m Autocorrelation functions calculated from k. n Spatial distribution of DdPTEN-Halo (left) or HsPTEN-Halo (right) and PHPKB-eGFP along the cell periphery. The position showing maximum PHPKB-eGFP intensity was adjusted to angle = 0. Error bars, SD (n = 5 cells). o Oscillation period of the traveling waves of PHPKB-eGFP in pten-null cells expressing DdPTEN-Halo (n = 94 cells; black) or HsPTEN-Halo (n = 67 cells; gray). Scale bars, 10 μm (a–c), 5 μm (g) and 3 μm (j)
