Fig. 3.
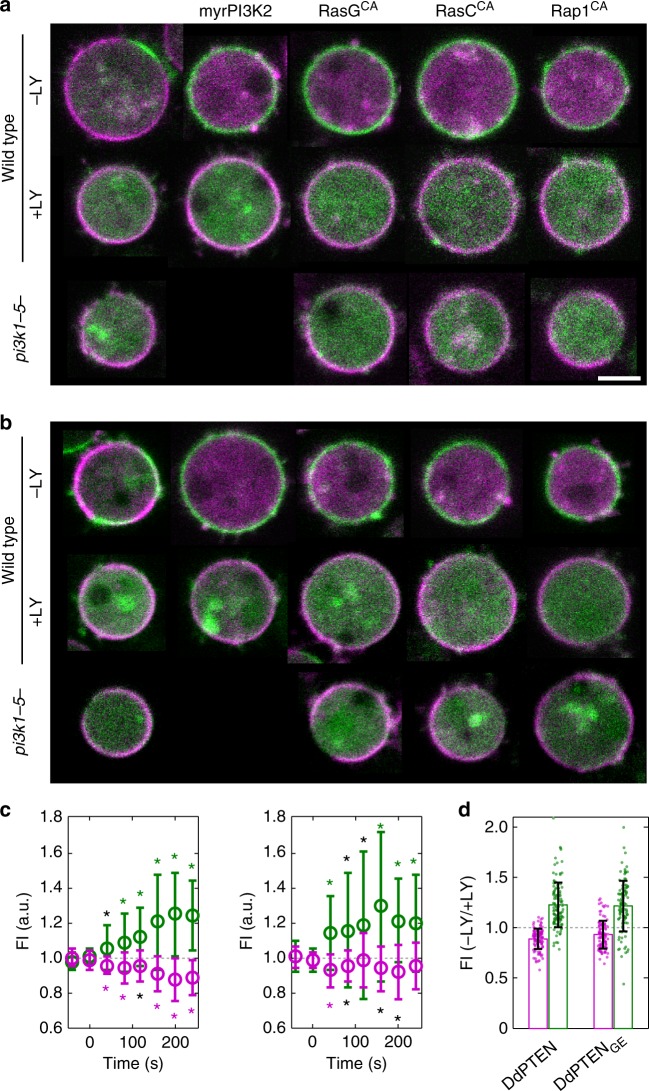
Mutual inhibition between PIP3 and PTEN excludes each other from the membrane. a Confocal images of DdPTEN-Halo-TMR and PHPKB-eGFP in living cells expressing myrPI3K2 or constitutively active forms of small G proteins in the absence (top) or presence (middle) of 40 μM LY294002 or in the background of pi3k1-5-null (bottom). b Confocal images of DdPTENG129E-Halo-TMR and PHPKB-eGFP in living cells expressing myrPI3K2 or constitutively active form of small G proteins. c Quantification of the fluorescence intensities of DdPTEN-Halo (open magenta circle; left; n = 17) or DdPTENG129E-Halo (right; n = 15) and PHPKB-eGFP (open green circle) on the cell membrane of wild-type cells expressing myrPI3K2 before and after the dilution of LY294002 at t = 0. Error bars, SD. Black and colored asterisks indicate significant differences after the dilution (P < 0.05, P < 0.01). d Fluorescence intensities of DdPTEN (magenta) and PHPKB-eGFP (green) after the dilution relative to before the dilution. The data obtained by 7 measurements at different time points in the same cells as c were shown. Error bars, SD. P = 0.012 and 0.742 (DdPTEN versus DdPTENG129E for DdPTEN and PHPKB). P values were obtained by Welch’s t test. Scale bar, 5 μm

