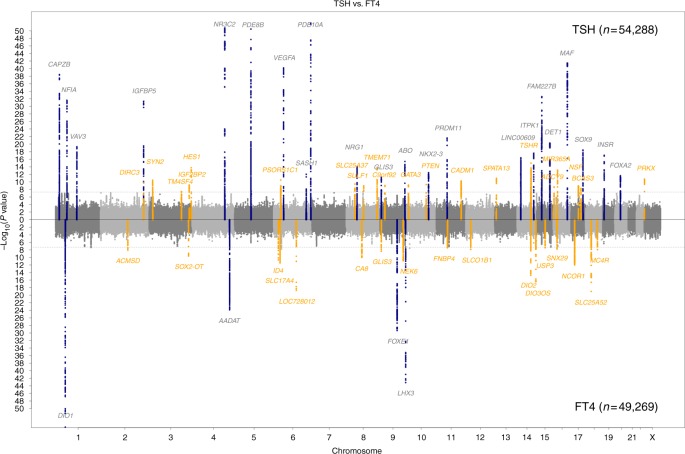
Fig. 1.
Manhattan plots for GWAS meta-analyses of thyroid function. Manhattan plots of the GWAS meta-analysis results for TSH and FT4 contrasted with each other. SNPs are plotted on the x axis according to their position on each chromosome with −log10(p-value) of the association test on the y axis. The upper solid horizontal line indicates the threshold for genome-wide significance, i.e., 5 × 10⁻⁸. Genomic loci previously known to contain trait-associated variants are colored in blue, new loci in orange

