Fig. 4.
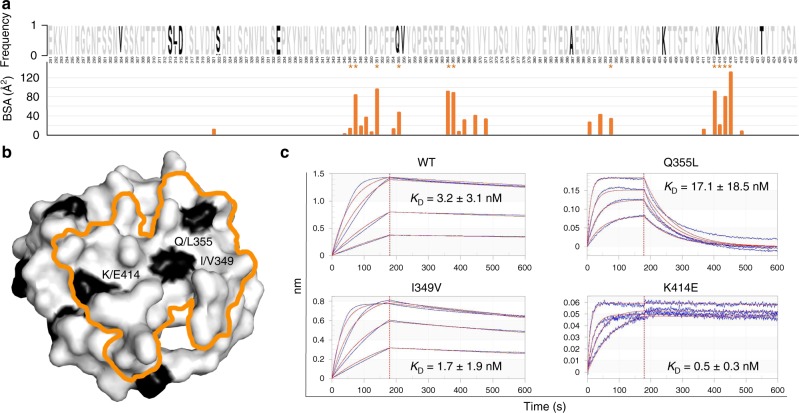
Pfs48/45 sequence polymorphisms in the 85RF45.1 epitope. a Weblogo58 representation of sequence variability in Pfs48/45 6C. Sequences were compiled from the NCBI, PlasmoDB, and Uniprot databases. Invariant and polymorphic residues are colored gray and black, respectively. The buried surface area of each Pfs48/45 residue contacted by mAb 85RF45.1 as determined by PISA59 is shown below. An asterisk denotes a Pfs48/45 residue that forms an H-bond or salt bridge with mAb 85RF45.1. b Polymorphism mapped onto the Pfs48/45 surface colored according to a. The 85RF45.1 epitope is outlined in orange. c Binding affinity of 85RF45.1 Fab to Pfs48/45 6C constructs with point mutations representative of sequence polymorphisms in the 85RF45.1 epitope. Blue lines are representative of raw data, whereas red curves represent global fitting. The different sensograms correspond to Fab concentrations of 250, 125, 62.5, and 31.3 nM. KD’s are indicated with standard deviation and derive from at least two independent measurements

