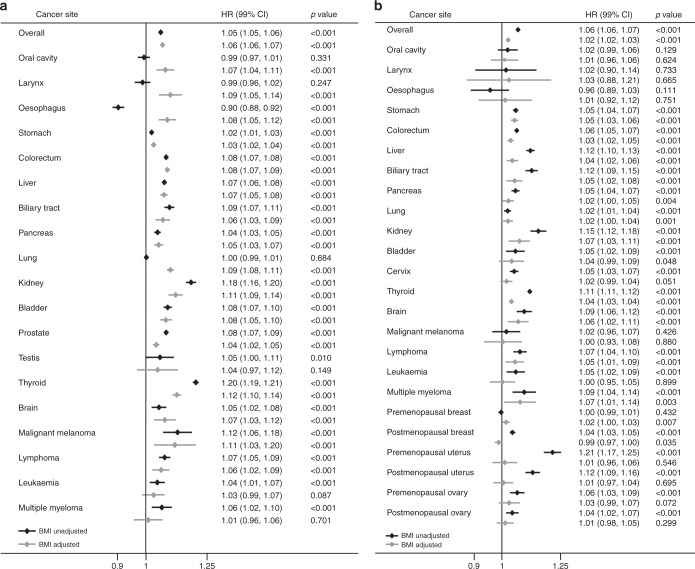
Fig. 1.
Forest plot of the HR for each cancer across WC quintiles before and after BMI adjustment, from models (adjusted for age, smoking status (3 categories), alcohol drinking (3 categories), physical activity (2 categories), co-morbidities (e.g., hypertension, type 2 diabetes, and hyperlipidemia; all are 2 categories, respectively), and socioeconomic status (2 categories)) fitted as a linear effect. a Male. b Female. HR hazard ratio, WC waist circumference, BMI body mass index

