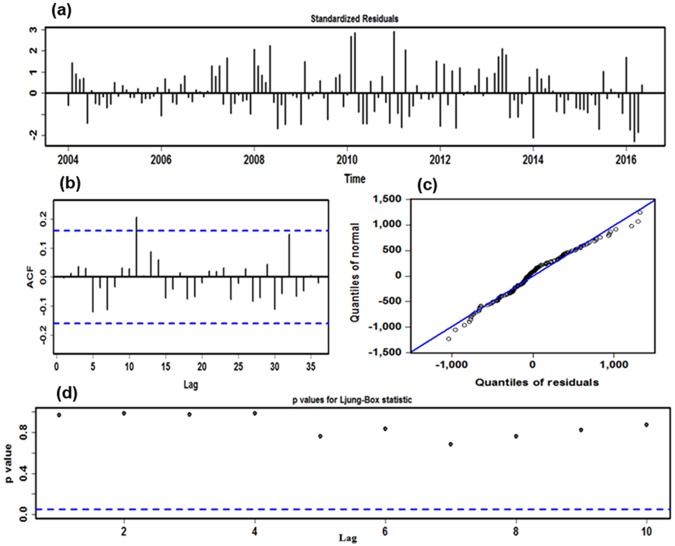
Figure 2.
Residual diagnostic plots of ARIMA (1,1,1) × (0,1,1)12 model. (a) Standardized residuals. (b) Autocorrelation function (ACF) plot of the time-series residuals. (c) Normal Q-Q plot for determining the normality of the time-series residuals. (d) P values for Ljung-Box statistic. The ACF shows that no significant residual correlations are observed in the time series at the 5% level, and P values for Ljung-Box statistic are never significant at various lags. The normal Q-Q graph of the time-series residuals approximately falls along the line. These imply the selected ARIMA method offers a reasonable simulation to the monthly human brucellosis time series.

