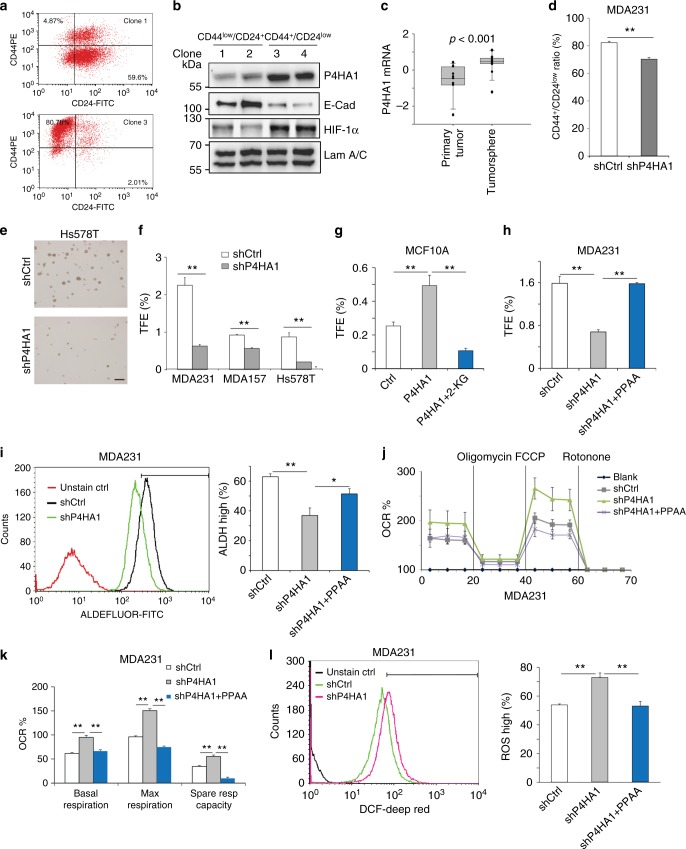
Fig. 5.
P4HA regulates cancer cell stemness through the HIF-1 pathway. a, b Expression of HIF-1α, P4HA1, and E-cadherin was assessed in CD44low/CD24+ clones and CD44+/CD24–/low clones. c Quantification of mRNA levels of P4HA1 in primary breast cancer tissue and tumor spheroids derived from those tissues. The gene expression values were derived from published microarray dataset. The data were log 2 transformed and mean centered. Primary tumor, n = 11; tumorsphere, n = 15. The median, 10th, 25th, 75th, and 90th percentiles were plotted as vertical boxes with error bars. The data were analyzed by Mann–Whitney rank-sum test. d FACS analysis of CD44+/CD24–/low population in shCtrl and shP4HA1 MDA-MB-231 cells. Results are presented as mean ± SEM; n = 3; **p < 0.01, independent Student’s t test. e, f Images of tumorspheres and quantification of tumorsphere formation efficiency (TFE) in control or P4HA1-silenced MDA-MB-231 cells, Hs578t cells, and MDA-MB-157 cells. Results are presented as mean ± SEM; n = 3; **p < 0.01, independent Student’s t test. g, h Quantification of tumorsphere formation efficiency (TFE) in control, P4HA1-expressing, and P4HA1-silenced cells in the presence or absence of octyl-α-ketoglutarate or HIF-1α PPAA. Results are presented as mean ± SEM; n = 3, **p < 0.01, one-way ANOVA test. i FACS analysis of aldehyde dehydrogenase (ALDH) activity in control, P4HA1-silenced MDA-MB-231 cells, and P4HA1-silenced MDA-MB-231 cells with HIF-1α PPAA. Results are presented as mean ± SEM; n = 3; *p < 0.05; **p < 0.01, one-way ANOVA test. j Seahorse analysis of oxygen consumption rate (OCR) in control, P4HA1-silenced MDA-MB-231 cells, and P4HA1-silenced MDA-MB-231 cells with HIF-1α PPAA. k Quantification of OCR from j; n = 30; results are presented as mean ± SEM; **p < 0.01, one-way ANOVA test. l FACS quantification of ROS levels in control or P4HA1-silenced MDA-MB-231 cells in the presence or absence of HIF-1α PPAA; n = 3, results are presented as mean ± SEM; **p < 0.01, one-way ANOVA test

