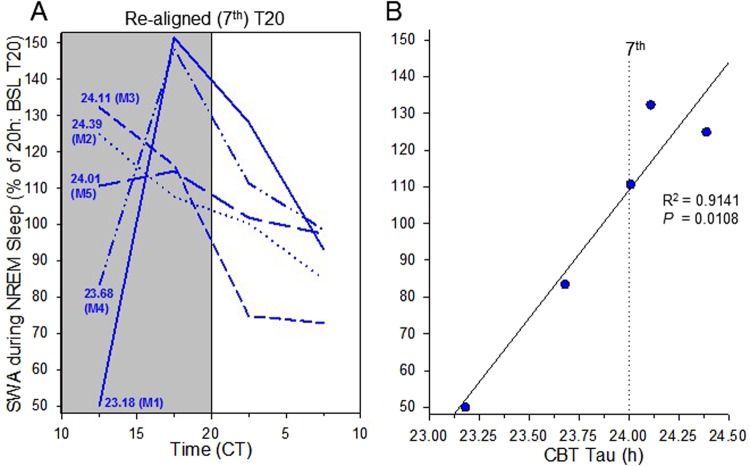
Figure 6.
Effects of individual period on NREM sleep slow wave activity (SWA). (A): Individual time course of corrected EEG SWA based upon the individual animal’s CBT period (for the re-aligned T20 cycle). The numbers at the first SWA interval indicate the individual animal’s period (for the 5 mice M1 to M5). Individual EEG SWA was expressed relative to the 20 hours of the baseline T20 cycle (=100%). (B): Correlations between NREM SWA during the first “re-aligned” interval with the individual animal’s CBT period. Pearson’s correlation coefficient (R-squared) and its P value are indicated on the graph.

