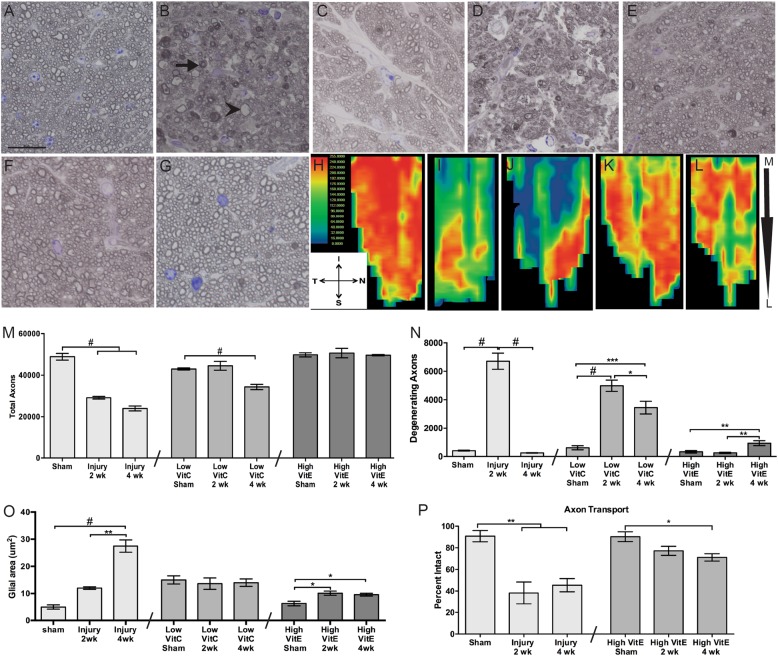
Fig. 4. High-VitE diet prevents injury-induced axon degeneration and axon transport deficits.
a-g Representative brightfield micrographs of ON from a sham (scale represents 20 μm and applies to all micrographs); b 2-week post-blast (arrow indicates re-myelination; arrowhead indicates Wallerian degeneration); c 4 week post-blast (note the loss of small axons); d 2 week post-blast low-VitC-diet; e 4 week post-blast low-VitC-diet; f 2-week post-blast high-VitE-diet; and g 4 week post-blast high-VitE-diet mice. h-l Representative heat maps of fluorescently tagged CTB in the superior colliculus of sham (h), 2 week post-blast (i), 4 week post-blast (j), 2 week post-blast high-VitE-diet (k), and 4 week post-blast high-VitE-diet (l) mice. Medial (M), lateral superior colliculs (L), inferior (I), nasal (N), superior (S), and temporal (T) regions of the retinotopic map on the superior colliculus. m Quantification of total axons at 2 and 4 weeks after blast exposure in all diet groups as compared to their respective shams. Total axons were preserved in the high-VitE-diet group only. n Quantification of degenerative axons at 2 and 4 weeks after blast exposure in all diet groups as compared to their respective shams. Axon degeneration was more sustained in the low-VitC-diet group and was lowest overall in the high-VitE-diet group. o Quantification of cross-sectional ON glial area at 2 and 4 weeks after blast exposure in all diet groups as compared to their respective shams. Baseline glial area was elevated in the low-VitC-diet group and was unchanged after injury. The increase in glia area was less than in controls in the high-VitE-diet group. p Quantification of axon transport based on CTB fluorescence levels in the superior colliculus. Axon transport was preserved in the mice on the high-VitE diet. This experiment was repeated twice. n = 5 for all groups. *p < 0.05, **p < 0.01, ***p < 0.001, #p < 0.0001

